第8章 图表实例
import pandas as pd
import numpy as np
import matplotlib as mpl
#mpl.use("agg")
import matplotlib.pyplot as plt
import matplotlib.lines as mlines
import matplotlib.patches as mpatches
from matplotlib.legend_handler import HandlerLine2D, HandlerTuple
from numpy.random import randn
import seaborn as sns
from matplotlib import ticker
from matplotlib.gridspec import GridSpec
plt.rcParams['font.sans-serif']=['Simhei']; #SimHei黑体
plt.rcParams['axes.unicode_minus']=False; #正常显示图中负号
#teacher = pd.read_csv("data/数据/school/1_teacher.csv")
student = pd.read_csv("data/数据/school/2_student_info.csv")
#kaoqin = pd.read_csv("data/数据/school/3_kaoqin.csv")
#kaoqin_type = pd.read_csv("data/数据/school/4_kaoqintype.csv")
chengji = pd.read_csv("data/数据/school/5_chengji.csv")
#exam_type = pd.read_csv("data/数据/school/6_exam_type.csv")
#consumption = pd.read_csv("data/数据/school/7_consumption.csv")
#teacher.head().pipe(lambda df:print(df.to_markdown(tablefmt="github")))
student.head().pipe(lambda df:print(df.to_markdown(tablefmt="github")))| bf_StudentID | bf_Name | bf_sex | bf_nation | bf_BornDate | cla_Name | bf_NativePlace | Bf_ResidenceType | bf_policy | cla_id | cla_term | bf_zhusu | bf_leaveSchool | bf_qinshihao | |
|---|---|---|---|---|---|---|---|---|---|---|---|---|---|---|
| 0 | 14454 | 陈某某 | 女 | 汉族 | 2001 | 白-高二(01) | 宁波 | 城镇 | 共青团员 | 901 | 2018-2019-1 | nan | nan | nan |
| 1 | 14479 | 曹某某 | 男 | 汉族 | nan | 白-高二(01) | nan | 城镇 | 共青团员 | 901 | 2018-2019-1 | 1 | nan | 315 |
| 2 | 14486 | 金某某 | 男 | 汉族 | nan | 白-高二(01) | nan | 城镇 | 共青团员 | 901 | 2018-2019-1 | 1 | nan | 321 |
| 3 | 14549 | 张某某 | 女 | 汉族 | 2002 | 白-高二(07) | 浙江平湖 | 城镇 | 共青团员 | 907 | 2018-2019-1 | nan | nan | nan |
| 4 | 14550 | 张某某 | 女 | 汉族 | 2001 | 白-高二(04) | 浙江宁波 | 城镇 | 共青团员 | 904 | 2018-2019-1 | nan | nan | nan |
#kaoqin.head().pipe(lambda df:print(df.to_markdown(tablefmt="github")))
#kaoqin_type.head().pipe(lambda df:print(df.to_markdown(tablefmt="github")))
chengji.head().pipe(lambda df:print(df.to_markdown(tablefmt="github")))| mes_TestID | exam_number | exam_numname | mes_sub_id | mes_sub_name | exam_term | exam_type | exam_sdate | mes_StudentID | mes_Score | mes_Z_Score | mes_T_Score | mes_dengdi | |
|---|---|---|---|---|---|---|---|---|---|---|---|---|---|
| 0 | 136424 | 282 | 2017年9月宁波市“十校联考” | 17 | 政治 | 2017-2018-1 | 7 | 2017/9/20 00:00:00 | 13539 | -2 | nan | nan | nan |
| 1 | 136424 | 282 | 2017年9月宁波市“十校联考” | 17 | 政治 | 2017-2018-1 | 7 | 2017/9/20 00:00:00 | 13548 | 90 | 1.07451 | 88.5961 | 0.137615 |
| 2 | 136424 | 282 | 2017年9月宁波市“十校联考” | 17 | 政治 | 2017-2018-1 | 7 | 2017/9/20 00:00:00 | 13551 | 91 | 1.19415 | 89.5532 | 0.0917431 |
| 3 | 136424 | 282 | 2017年9月宁波市“十校联考” | 17 | 政治 | 2017-2018-1 | 7 | 2017/9/20 00:00:00 | 13555 | -2 | nan | nan | nan |
| 4 | 136424 | 282 | 2017年9月宁波市“十校联考” | 17 | 政治 | 2017-2018-1 | 7 | 2017/9/20 00:00:00 | 13559 | -2 | nan | nan | nan |
#exam_type.head().pipe(lambda df:print(df.to_markdown(tablefmt="github")))
#consumption.head().pipe(lambda df:print(df.to_markdown(tablefmt="github")))8.3 axes参数设置
8.3.1 tick_labels
#获取label对象
ax.xaxis.get_ticklabels()
#获取label对象并且设置label
for label in ax.xaxis.get_ticklabels():
    # 调用x轴刻度标签实例,是一个text实例
    label.set_color('red') # 颜色
    label.set_rotation(45) # 旋转角度
    label.set_fontsize(16) # 字体大小
#更改label和tick值,tick设置为[],ticks消失
# ax.xaxis.set_ticklabels()不被鼓励
ax.set_xticks(ticks,labels,minor=False,)
ax.yaxis.set_ticks(ticks,labels,minor=False)
8.3.2 ticks
grid被包括在ticks中
#获取ticks在一条轴上的位置
ax.xaxis.get_ticklocs(minor=False)

#设置一条轴的位置 上下左右或者让ticks和轴消失,label不消失
ax.xaxis.set_ticks_position()#{'top', 'bottom', 'both', 'default', 'none'}

# 获取ticks的线条,并且设置格式
for line in ax.xaxis.get_ticklines(minor=False):
    # 调用y轴刻度线条实例, 是一个Line2D实例
    line.set_markeredgecolor('green')    # 颜色
    line.set_markersize(25)    # marker大小
    line.set_markeredgewidth(2)# marker粗细

#设置ticks的参数
ax.xaxis.set_tick_params(which="major",rotation=45)#left,right,labelleft,labelright,gridon
ax.tick_params(axis=,which=,rotation=)

#设置刻度规模
ax.set_yscale()#设置x轴的规模,也就是量级,比如"linear", "log", "symlog", "logit"
ax.set_xscale()
ax.autoscale_view()#自动调整比例
- `matplotlib.scale.LinearScale`
- `matplotlib.scale.LogScale`
- `matplotlib.scale.SymmetricalLogScale`
- `matplotlib.scale.LogitScale`
- `matplotlib.scale.FuncScale`

direction : {'in', 'out', 'inout'}
    Puts ticks inside the Axes, outside the Axes, or both.
length : float
    Tick length in points.
width : float
    Tick width in points.
color : color
    Tick color.
pad : float
    Distance in points between tick and label.
labelsize : float or str
    Tick label font size in points or as a string (e.g., 'large').
labelcolor : color
    Tick label color.
colors : color
    Tick color and label color.
zorder : float
    Tick and label zorder.
bottom, top, left, right : bool
    Whether to draw the respective ticks.
labelbottom, labeltop, labelleft, labelright : bool
    Whether to draw the respective tick labels.
labelrotation : float
    Tick label rotation
grid_color : color
    Gridline color.
grid_alpha : float
    Transparency of gridlines: 0 (transparent) to 1 (opaque).
grid_linewidth : float
    Width of gridlines in points.
grid_linestyle : str
Any valid `.Line2D` line style spec.8.3.4 ticks-locator
locator=plt.MaxNLocator(nbins=7)#自动选择合适的位置,并且刻度之间最多不超过7(nbins)个间隔
locator=plt.FixedLocator(locs=[0,0.5,1.5,2.5,3.5,4.5,5.5,6])#直接指定刻度所在的位置
locator=plt.AutoLocator()#自动分配刻度值的位置
locator=plt.IndexLocator(offset=0.5, base=1)#面元间距是1,从0.5开始
locator=plt.MultipleLocator(1.5)#将刻度的标签设置为1.5的倍数
locator=plt.LinearLocator(numticks=5)#线性划分5等分,4个刻度 8.3.6 spines
设置四个轴线
ax.spines['left'].set_position('center')#set_position('center')将 x 和 y 轴放置在相应数据范围之间。 在这种情况下, y 轴上的数据范围是 -1 到 +1,所以中心点是 0,而 x 轴上的数据范围是 0 到 6,所以中心点是3。 因此,交点为(3, 0)。
ax.spines['right'].set_visible(False)#设置轴是否可见
ax.spines['top'].set_color('r')
ax.spines['top'].set_linewidth(1.7)
#关闭所有轴线
for spine in ax.spines.values():
    spine.set_visible(False)
8.4 图例

8.4.1 图例样式设置
8.4.1.1 主要参数
handles : sequence of `.Artist`, optional
A list of Artists (lines, patches) to be added to the legend.
Use this together with *labels*, if you need full control on what
is shown in the legend and the automatic mechanism described above
is not sufficient.

The length of handles and labels should be the same in this
case. If they are not, they are truncated to the smaller length.

labels : list of str, optional
A list of labels to show next to the artists.
Use this together with *handles*, if you need full control on what
is shown in the legend and the automatic mechanism described above
is not sufficient.

bbox_to_anchor : `.BboxBase`, 2-tuple, or 4-tuple of floats
Box that is used to position the legend in conjunction with *loc*.
Defaults to `axes.bbox` (if called as a method to `.Axes.legend`) or
`figure.bbox` (if `.Figure.legend`).  This argument allows arbitrary
placement of the legend.

Bbox coordinates are interpreted in the coordinate system given by
*bbox_transform*, with the default transform
Axes or Figure coordinates, depending on which ``legend`` is called.

If a 4-tuple or `.BboxBase` is given, then it specifies the bbox
``(x, y, width, height)`` that the legend is placed in.
To put the legend in the best location in the bottom right
quadrant of the axes (or figure)::

    loc='best', bbox_to_anchor=(0.5, 0., 0.5, 0.5)

A 2-tuple ``(x, y)`` places the corner of the legend specified by *loc* at
x, y.  For example, to put the legend's upper right-hand corner in the
center of the axes (or figure) the following keywords can be used::

    loc='upper right', bbox_to_anchor=(0.5, 0.5)
ncols : int, default: 1 The number of columns that the legend has.
8.4.1.2 其他参数
For backward compatibility, the spelling *ncol* is also supported
but it is discouraged. If both are given, *ncols* takes precedence.

loc : str or pair of floats, default: :rc:`legend.loc`
  The location of the legend.

  The strings
  ``'upper left', 'upper right', 'lower left', 'lower right'``
  place the legend at the corresponding corner of the axes/figure.

  The strings
  ``'upper center', 'lower center', 'center left', 'center right'``
  place the legend at the center of the corresponding edge of the
  axes/figure.

  The string ``'center'`` places the legend at the center of the axes/figure.

  The string ``'best'`` places the legend at the location, among the nine
  locations defined so far, with the minimum overlap with other drawn
  artists.  This option can be quite slow for plots with large amounts of
  data; your plotting speed may benefit from providing a specific location.

  The location can also be a 2-tuple giving the coordinates of the lower-left
  corner of the legend in axes coordinates (in which case *bbox_to_anchor*
  will be ignored).

  For back-compatibility, ``'center right'`` (but no other location) can also
  be spelled ``'right'``, and each "string" locations can also be given as a
  numeric value:

      ===============   =============
      Location String   Location Code
      ===============   =============
      'best'            0
      'upper right'     1
      'upper left'      2
      'lower left'      3
      'lower right'     4
      'right'           5
      'center left'     6
      'center right'    7
      'lower center'    8
      'upper center'    9
      'center'          10
      ===============   =============

prop : None or `matplotlib.font_manager.FontProperties` or dict
  The font properties of the legend. If None (default), the current
  :data:`matplotlib.rcParams` will be used.

fontsize : int or {'xx-small', 'x-small', 'small', 'medium', 'large', 'x-large', 'xx-large'}
  The font size of the legend. If the value is numeric the size will be the
  absolute font size in points. String values are relative to the current
  default font size. This argument is only used if *prop* is not specified.

labelcolor : str or list, default: :rc:`legend.labelcolor`
  The color of the text in the legend. Either a valid color string
  (for example, 'red'), or a list of color strings. The labelcolor can
  also be made to match the color of the line or marker using 'linecolor',
  'markerfacecolor' (or 'mfc'), or 'markeredgecolor' (or 'mec').

  Labelcolor can be set globally using :rc:`legend.labelcolor`. If None,
  use :rc:`text.color`.

numpoints : int, default: :rc:`legend.numpoints`
  The number of marker points in the legend when creating a legend
  entry for a `.Line2D` (line).

scatterpoints : int, default: :rc:`legend.scatterpoints`
  The number of marker points in the legend when creating
  a legend entry for a `.PathCollection` (scatter plot).

scatteryoffsets : iterable of floats, default: ``[0.375, 0.5, 0.3125]``
  The vertical offset (relative to the font size) for the markers
  created for a scatter plot legend entry. 0.0 is at the base the
  legend text, and 1.0 is at the top. To draw all markers at the
  same height, set to ``[0.5]``.

markerscale : float, default: :rc:`legend.markerscale`
  The relative size of legend markers compared with the originally
  drawn ones.

markerfirst : bool, default: True
  If *True*, legend marker is placed to the left of the legend label.
  If *False*, legend marker is placed to the right of the legend label.

reverse : bool, default: False
  If *True*, the legend labels are displayed in reverse order from the input.
  If *False*, the legend labels are displayed in the same order as the input.

  .. versionadded:: 3.7

frameon : bool, default: :rc:`legend.frameon`
  Whether the legend should be drawn on a patch (frame).

fancybox : bool, default: :rc:`legend.fancybox`
  Whether round edges should be enabled around the `.FancyBboxPatch` which
  makes up the legend's background.

shadow : bool, default: :rc:`legend.shadow`
  Whether to draw a shadow behind the legend.

framealpha : float, default: :rc:`legend.framealpha`
  The alpha transparency of the legend's background.
  If *shadow* is activated and *framealpha* is ``None``, the default value is
  ignored.

facecolor : "inherit" or color, default: :rc:`legend.facecolor`
  The legend's background color.
  If ``"inherit"``, use :rc:`axes.facecolor`.

edgecolor : "inherit" or color, default: :rc:`legend.edgecolor`
  The legend's background patch edge color.
  If ``"inherit"``, use take :rc:`axes.edgecolor`.

mode : {"expand", None}
  If *mode* is set to ``"expand"`` the legend will be horizontally
  expanded to fill the axes area (or *bbox_to_anchor* if defines
  the legend's size).

bbox_transform : None or `matplotlib.transforms.Transform`
  The transform for the bounding box (*bbox_to_anchor*). For a value
  of ``None`` (default) the Axes'
  :data:`~matplotlib.axes.Axes.transAxes` transform will be used.

title : str or None
  The legend's title. Default is no title (``None``).

title_fontproperties : None or `matplotlib.font_manager.FontProperties` or dict
  The font properties of the legend's title. If None (default), the
  *title_fontsize* argument will be used if present; if *title_fontsize* is
  also None, the current :rc:`legend.title_fontsize` will be used.

title_fontsize : int or {'xx-small', 'x-small', 'small', 'medium', 'large', 'x-large', 'xx-large'}, default: :rc:`legend.title_fontsize`
  The font size of the legend's title.
  Note: This cannot be combined with *title_fontproperties*. If you want
  to set the fontsize alongside other font properties, use the *size*
  parameter in *title_fontproperties*.

alignment : {'center', 'left', 'right'}, default: 'center'
  The alignment of the legend title and the box of entries. The entries
  are aligned as a single block, so that markers always lined up.

borderpad : float, default: :rc:`legend.borderpad`
  The fractional whitespace inside the legend border, in font-size units.

labelspacing : float, default: :rc:`legend.labelspacing`
  The vertical space between the legend entries, in font-size units.

handlelength : float, default: :rc:`legend.handlelength`
  The length of the legend handles, in font-size units.

handleheight : float, default: :rc:`legend.handleheight`
  The height of the legend handles, in font-size units.

handletextpad : float, default: :rc:`legend.handletextpad`
  The pad between the legend handle and text, in font-size units.

borderaxespad : float, default: :rc:`legend.borderaxespad`
  The pad between the axes and legend border, in font-size units.

columnspacing : float, default: :rc:`legend.columnspacing`
  The spacing between columns, in font-size units.

handler_map : dict or None
  The custom dictionary mapping instances or types to a legend
  handler. This *handler_map* updates the default handler map
  found at `matplotlib.legend.Legend.get_legend_handler_map`.

draggable : bool, default: False
  Whether the legend can be dragged with the mouse.
8.4.2 双轴或者多图
fig1 = plt.figure()
ax1 = fig1.add_subplot(111)
ax2 = ax1.twinx()
legend_1 = ax1.bar(list("abc"),[1,2,3],width=0.6,color="red")
legend_2 = ax2.bar(list("abc"),[4,5,6],width=0.5)
ax1.legend(handles=[legend_1,legend_2],labels=["a","b"])
plt.show()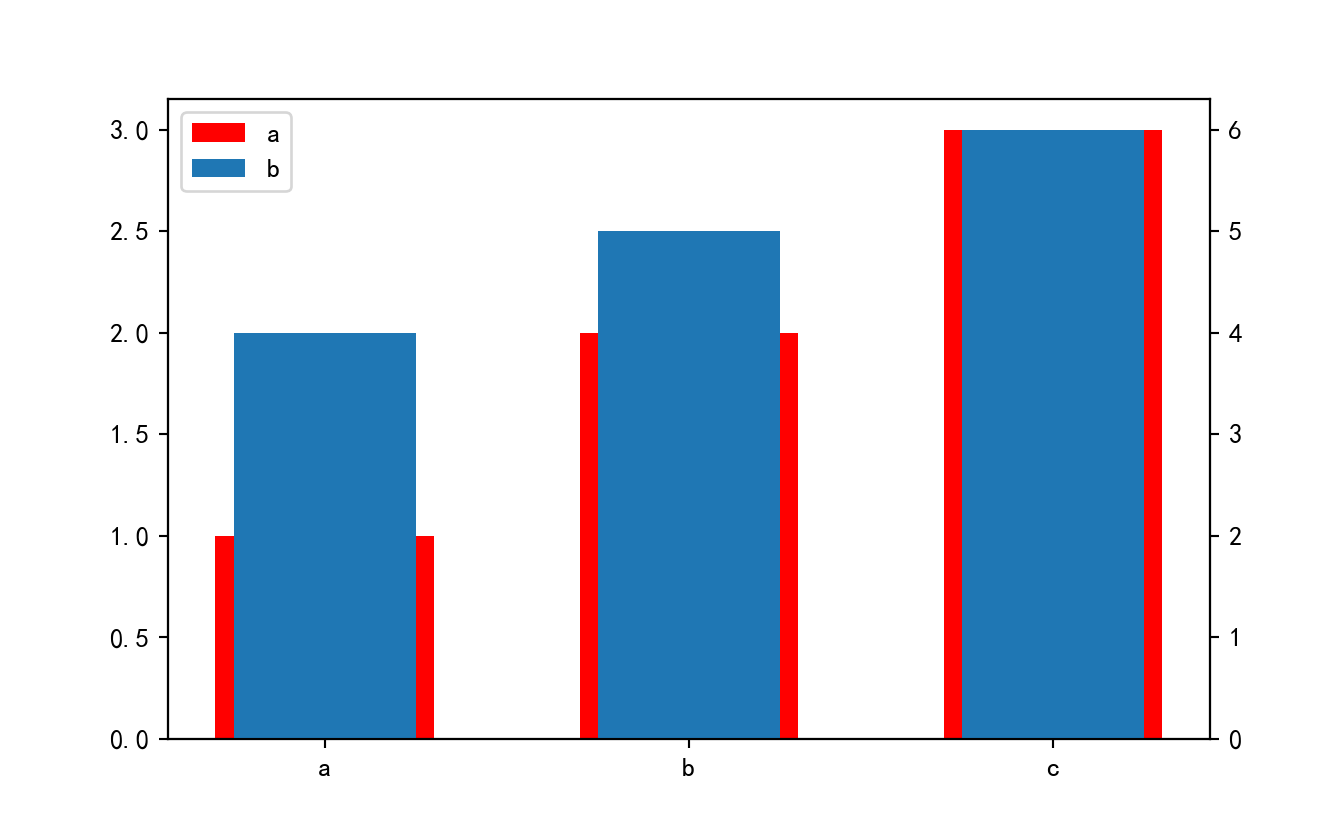
8.4.3 自定义图例
from matplotlib.legend_handler import
8.4.3.1 创造
自定义用于图例显示的图形import matplotlib.patches as mpatches
fig, ax = plt.subplots()
red_patch = mpatches.Patch(color='red', label='The red data')
blue_line = mlines.Line2D([], [], color='blue', marker='*',
                          markersize=15, label='Blue stars')
ax.legend(handles=[red_patch,blue_line])

plt.show()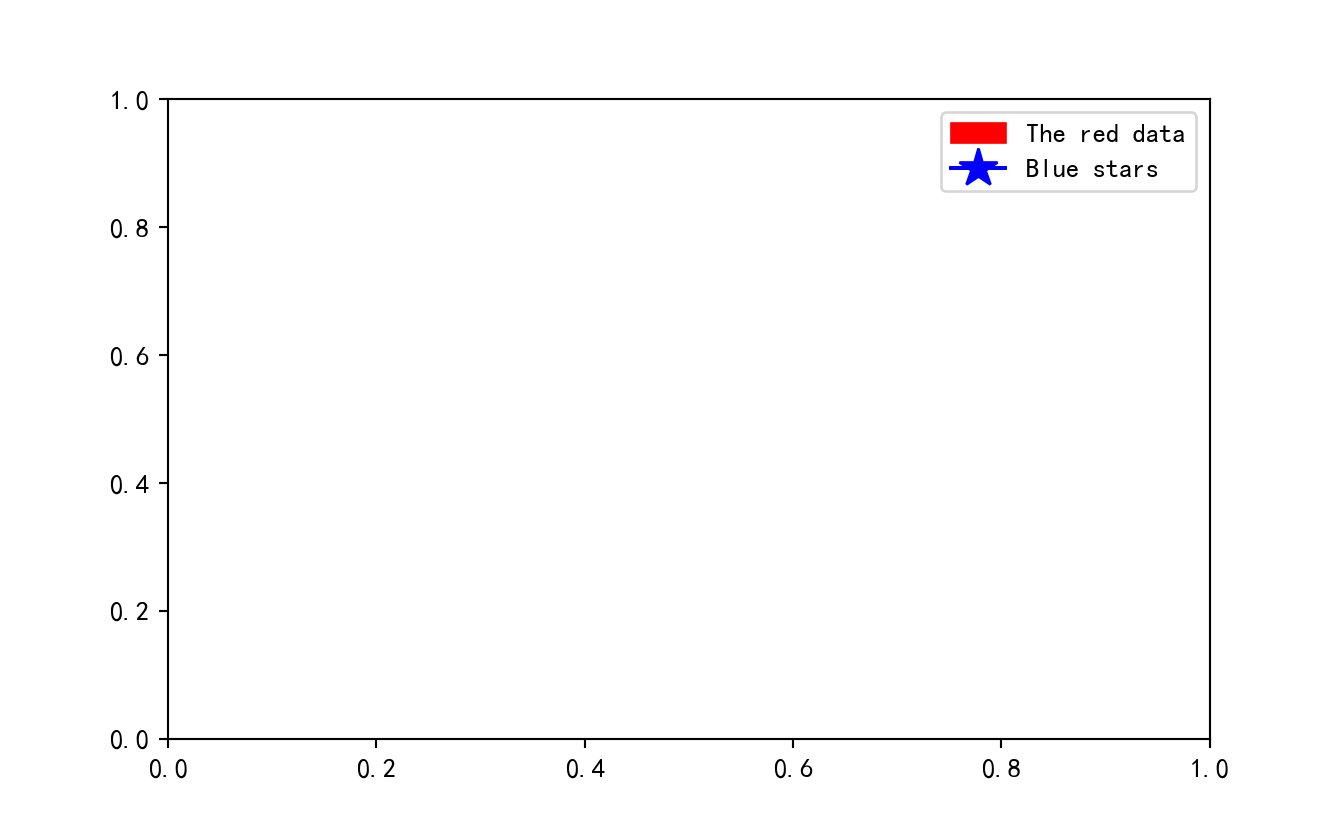
8.4.3.2 分组
将某几个图例分为一组,同代表某一类,默认一个tuple内的叠加显示。
fig, ax = plt.subplots()
p1, = ax.plot([1, 2.5, 3], 'r-d')
p2, = ax.plot([3, 2, 1], 'k-o')
l = ax.legend([(p1, p2)], ['Two keys'], numpoints=1,
              handler_map={tuple: HandlerTuple(ndivide=None)})
plt.show()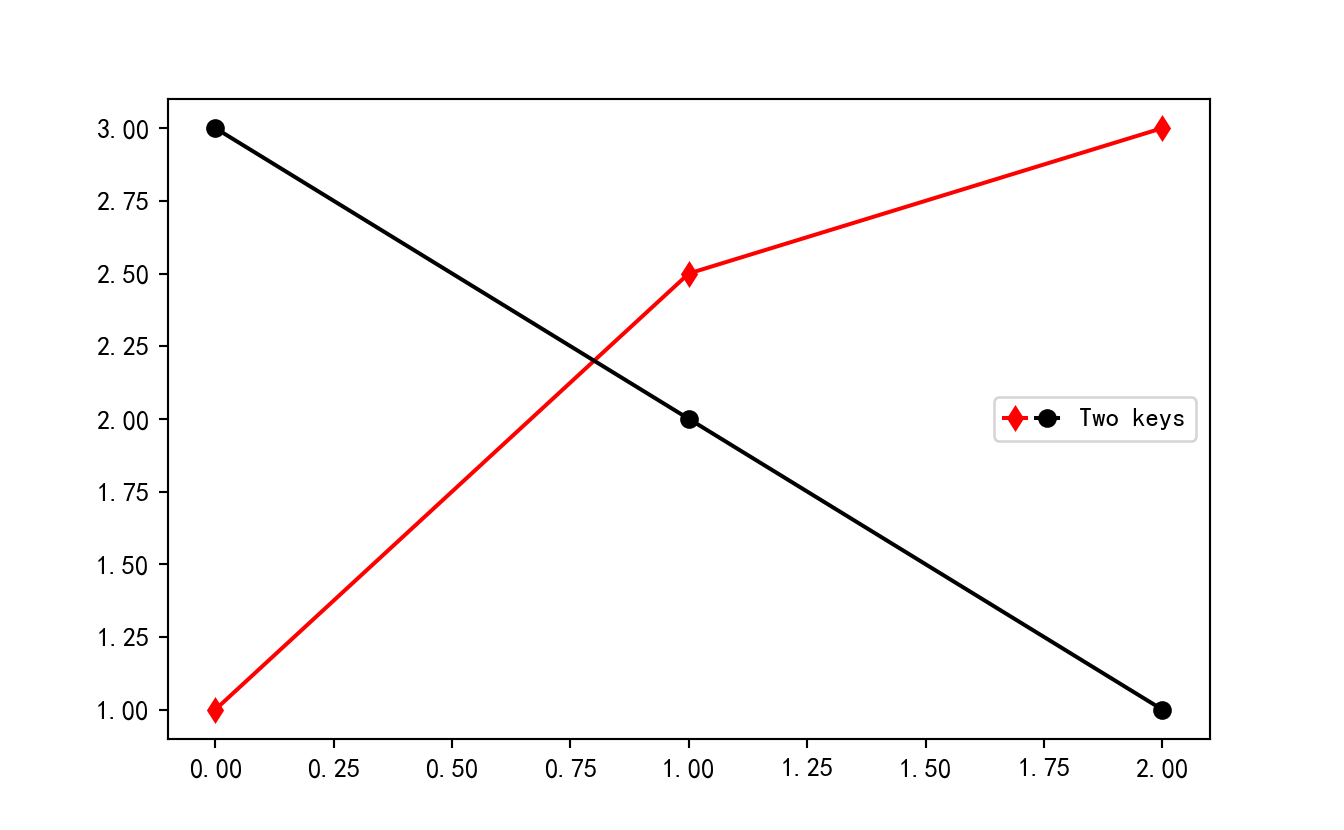
8.4.3.3 分离
即在一个axes上显示多个图例,legend可以多次调用
fig, ax = plt.subplots()
line1, = ax.plot([1, 2, 3], label="Line 1", linestyle='--')
line2, = ax.plot([3, 2, 1], label="Line 2", linewidth=4)

# Create a legend for the first line.
first_legend = ax.legend(handles=[line1], loc='upper right')

# Add the legend manually to the Axes.
ax.add_artist(first_legend)

# Create another legend for the second line.
ax.legend(handles=[line2], loc='lower right')

plt.show()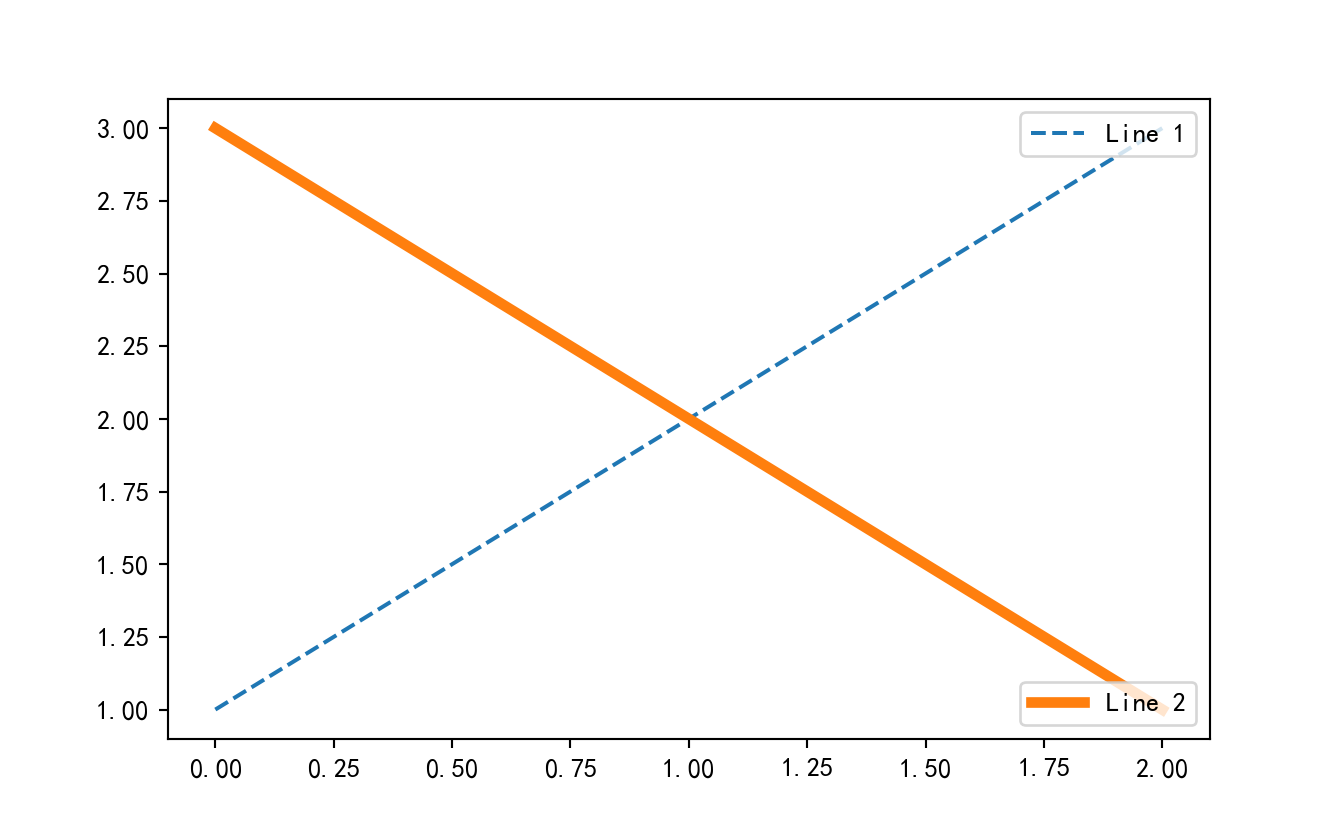
8.4.3.4 叠加
z = randn(10)

fig, ax = plt.subplots()
red_dot, = ax.plot(z, "ro", markersize=15)
# Put a white cross over some of the data.
white_cross, = ax.plot(z[:5], "w+", markeredgewidth=3, markersize=15)

ax.legend([red_dot, (red_dot, white_cross)], ["Attr A", "Attr A+B"])

plt.show()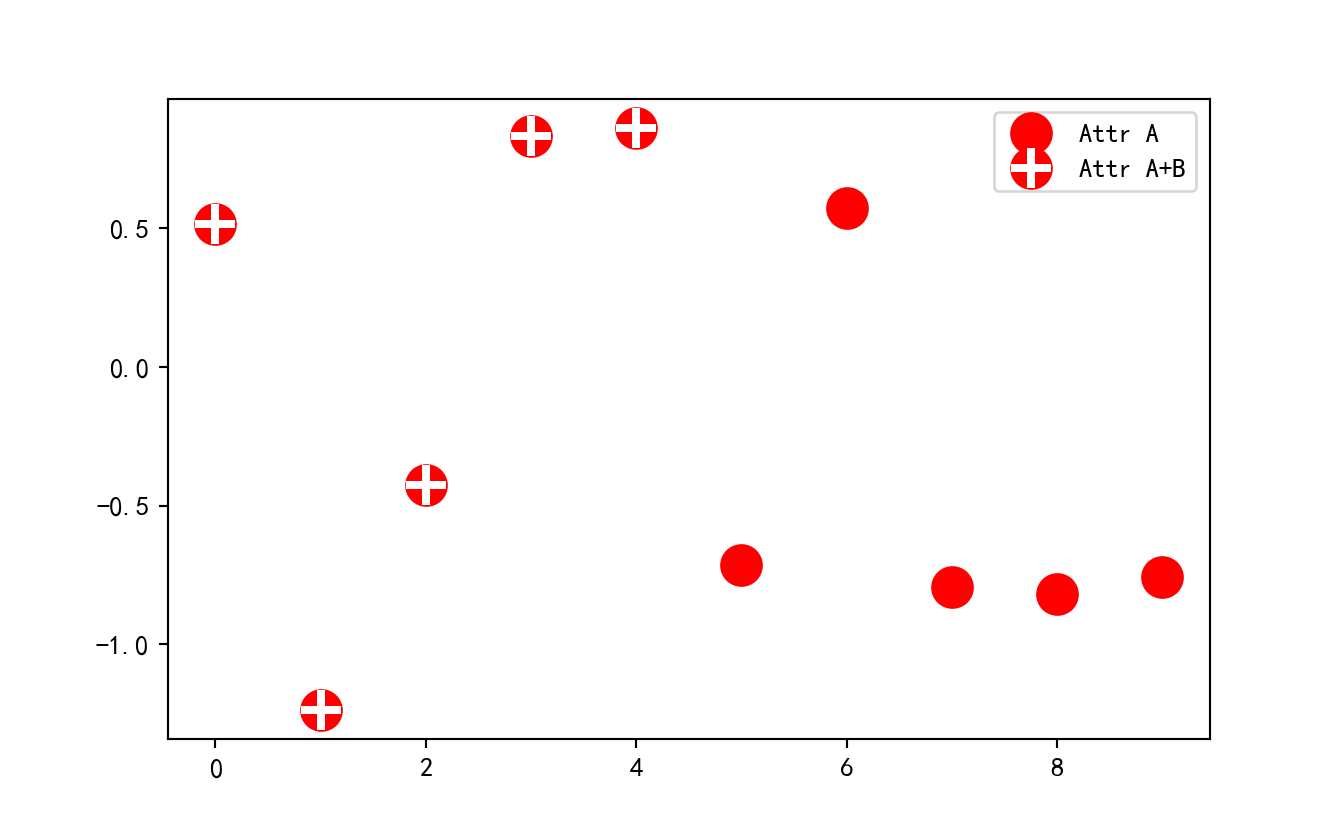
8.4.3.5 位置
- 用
bbox_to_anchor参数
fig,ax = plt.subplots(1,1,figsize=(8,8))
l1=ax.bar(list("abc"),[1,2,3],label="a")
l2=ax.bar(list("abc"),[4,5,6],label="b")
z = ax.legend(handles=[l1,l2],bbox_to_anchor=(1,1.1),ncols=2,loc="best",handleheight=4,handlelength=4)
for i in z.get_patches():
    i.set_height(30)
plt.show()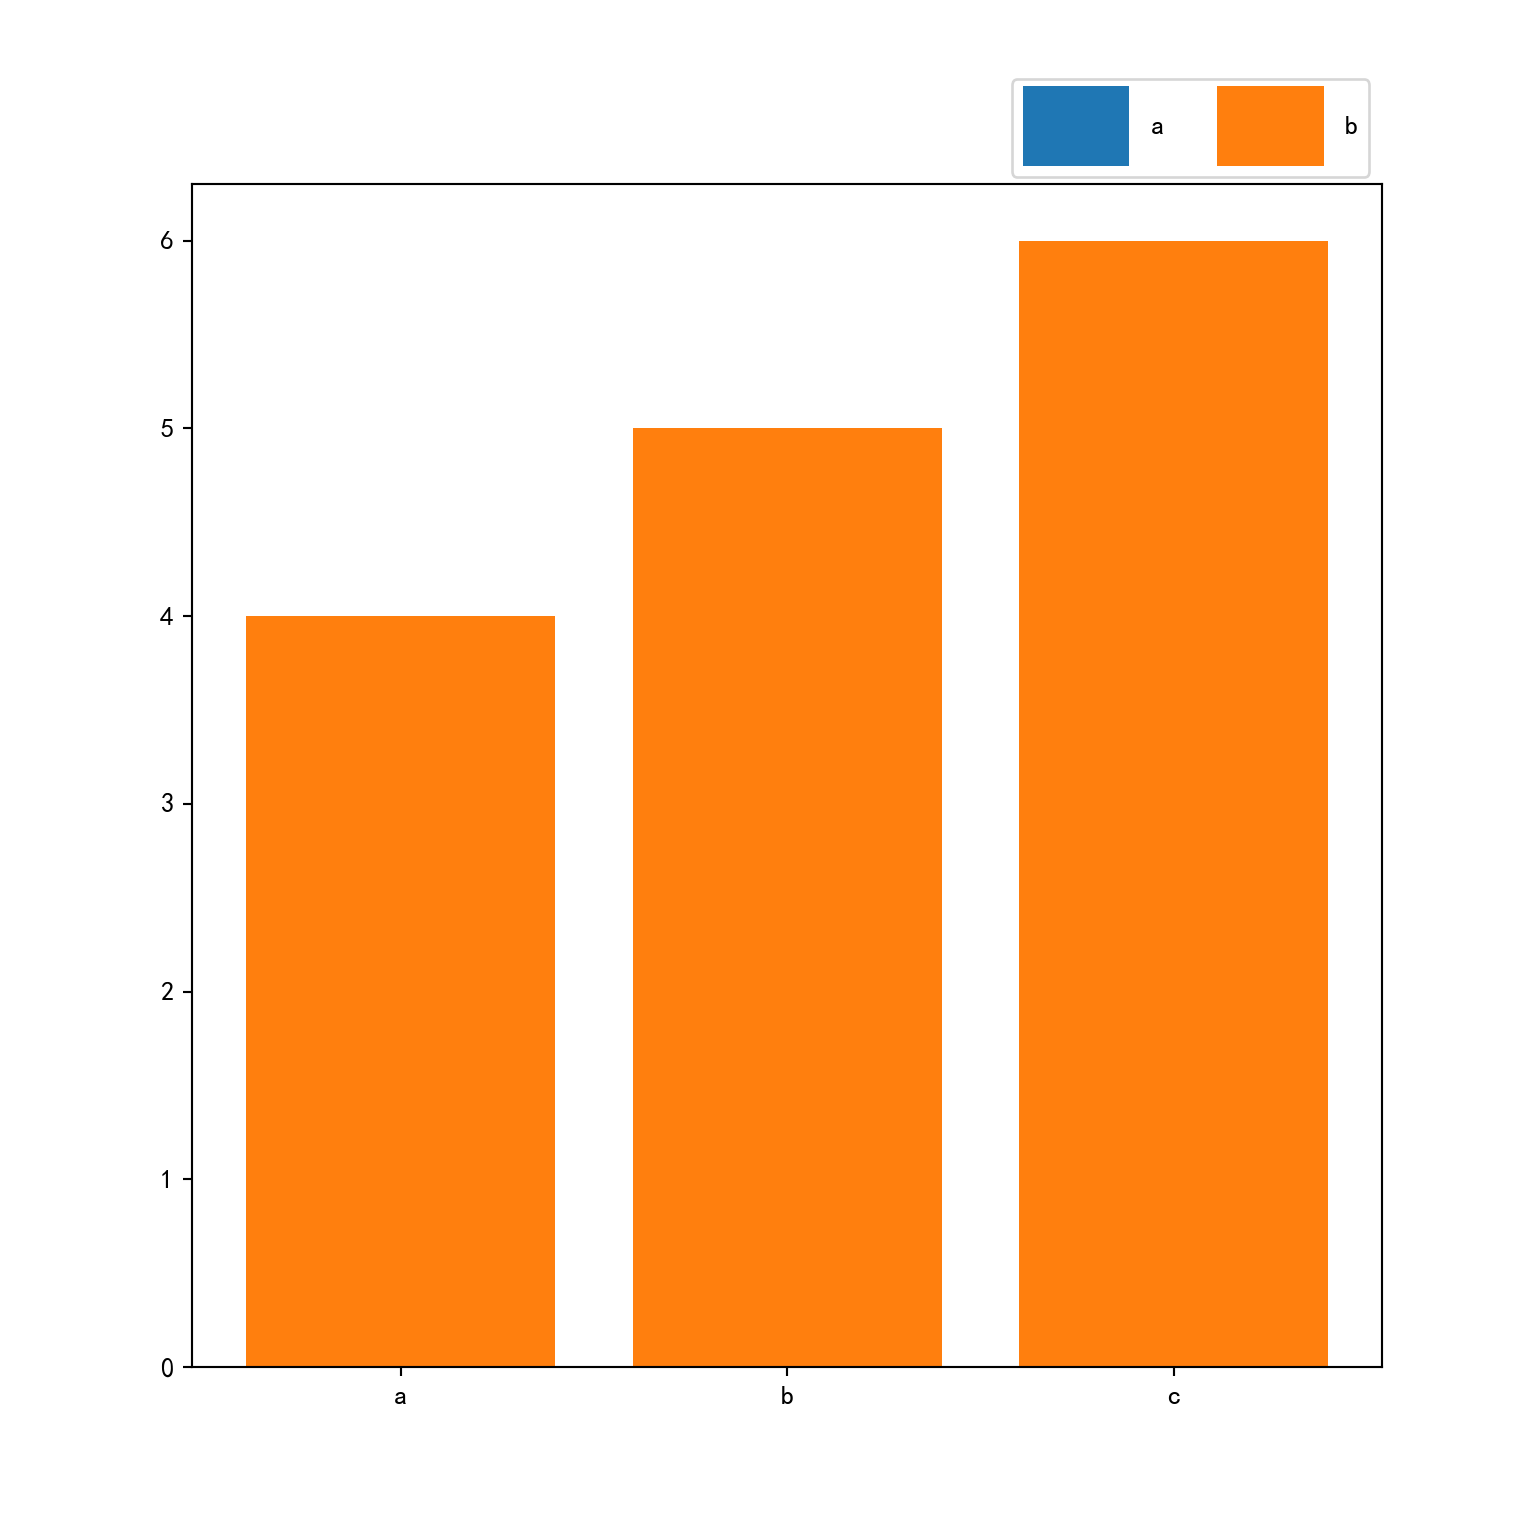
- 用loc
ucl = ['upper', 'center', 'lower']
lcr = ['left', 'center', 'right']
fig, ax = plt.subplots(figsize=(6, 4), layout='constrained', facecolor='0.7')

ax.plot([1, 2], [1, 2], label='TEST')
# Place a legend to the right of this smaller subplot.
for loc in [
        'outside upper left',
        'outside upper center',
        'outside upper right',
        'outside lower left',
        'outside lower center',
        'outside lower right']:
    t = fig.legend(loc=loc, title=loc)

fig, ax = plt.subplots(figsize=(6, 4), layout='constrained', facecolor='0.7')
ax.plot([1, 2], [1, 2], label='test')

for loc in [
        'outside left upper',
        'outside right upper',
        'outside left lower',
        'outside right lower']:
    t = fig.legend(loc=loc, title=loc)
plt.show()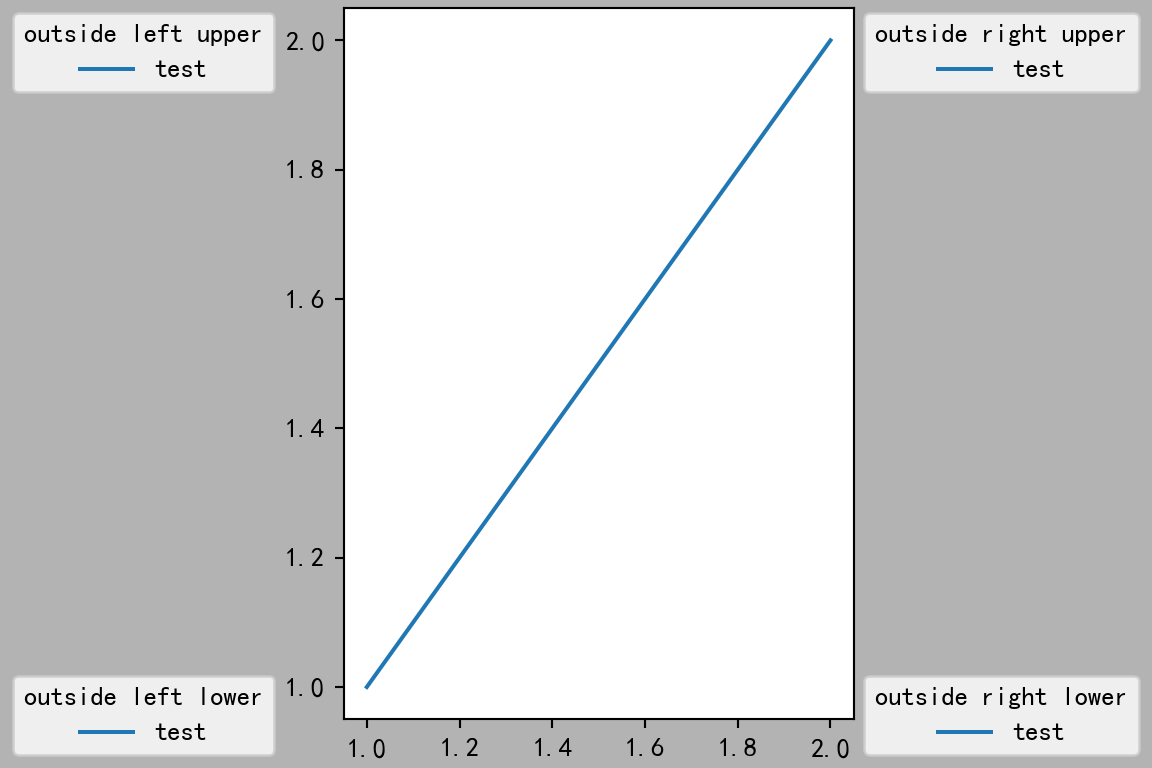
8.5 柱形图/条形图
8.5.1 基本柱形图
8.5.1.1 简单示例
可以展示一个种类的各个数值,适用与分类数据
# 展示某一次考试某位学生的各科成绩柱形图
sub_score = chengji[(chengji.mes_StudentID == 13539) & (chengji.exam_number == 282)][["mes_sub_name","mes_Score"]].query("mes_Score>0")
con = plt.bar("mes_sub_name","mes_Score",data=sub_score)
plt.show()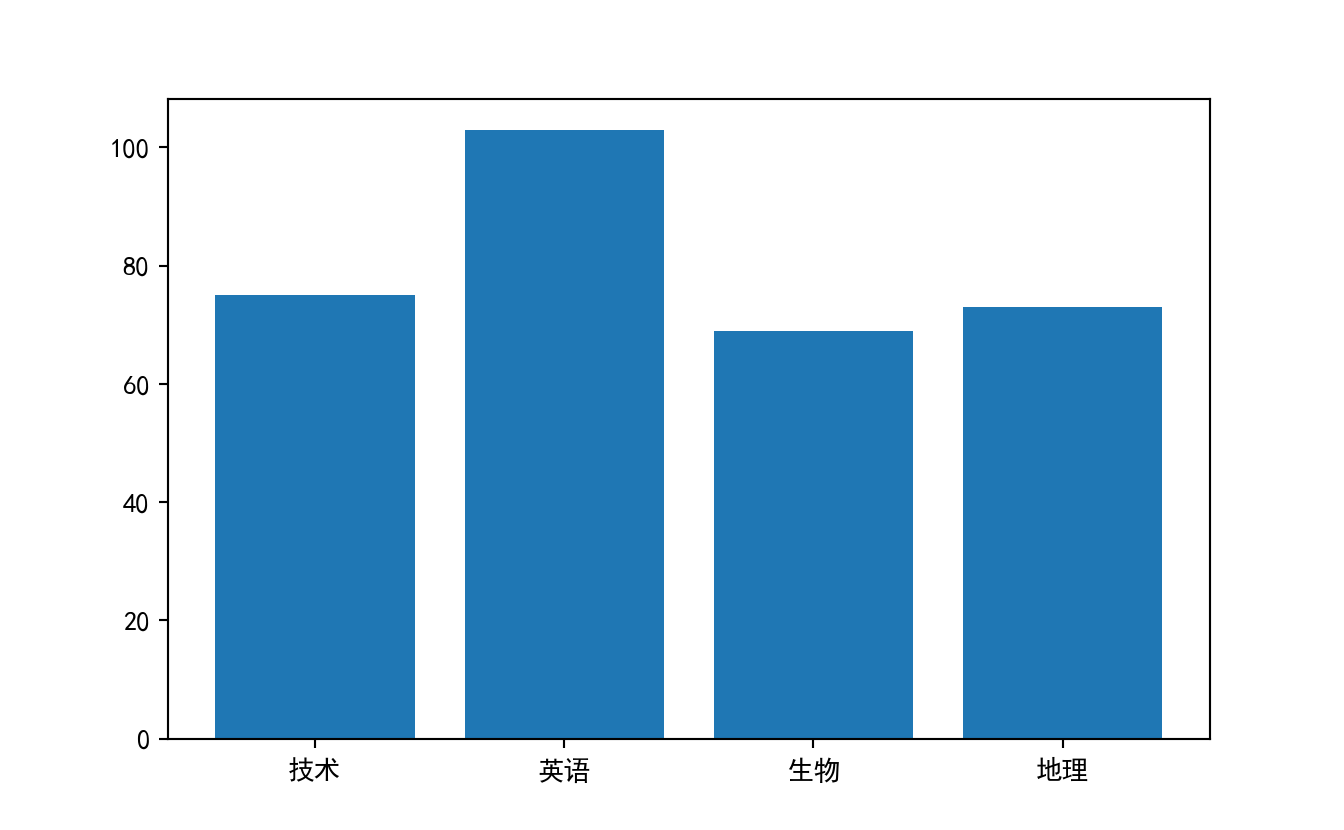
8.5.1.2 调优
fig = plt.figure(figsize=(4.8,5))
ax = fig.add_subplot(111)
#返回barcontainer
bc = plt.bar(
    "mes_sub_name",
    "mes_Score",
    width=0.6,
    data=sub_score
)

# 轴和刻度设置
for spine in ax.spines.values():
    spine.set_visible(False)
ax.xaxis.set_ticks_position("none")
#ax.yaxis.grid(True)

# 在正上方添加数值标签
for bar in ax.patches:
    t = ax.text(bar.get_x()+1/2*bar.get_width(),bar.get_height(),bar.get_height(),ha="center",va="bottom")

# 设置第一个bar为红色
bc.patches[0].set_facecolor("red")

plt.show()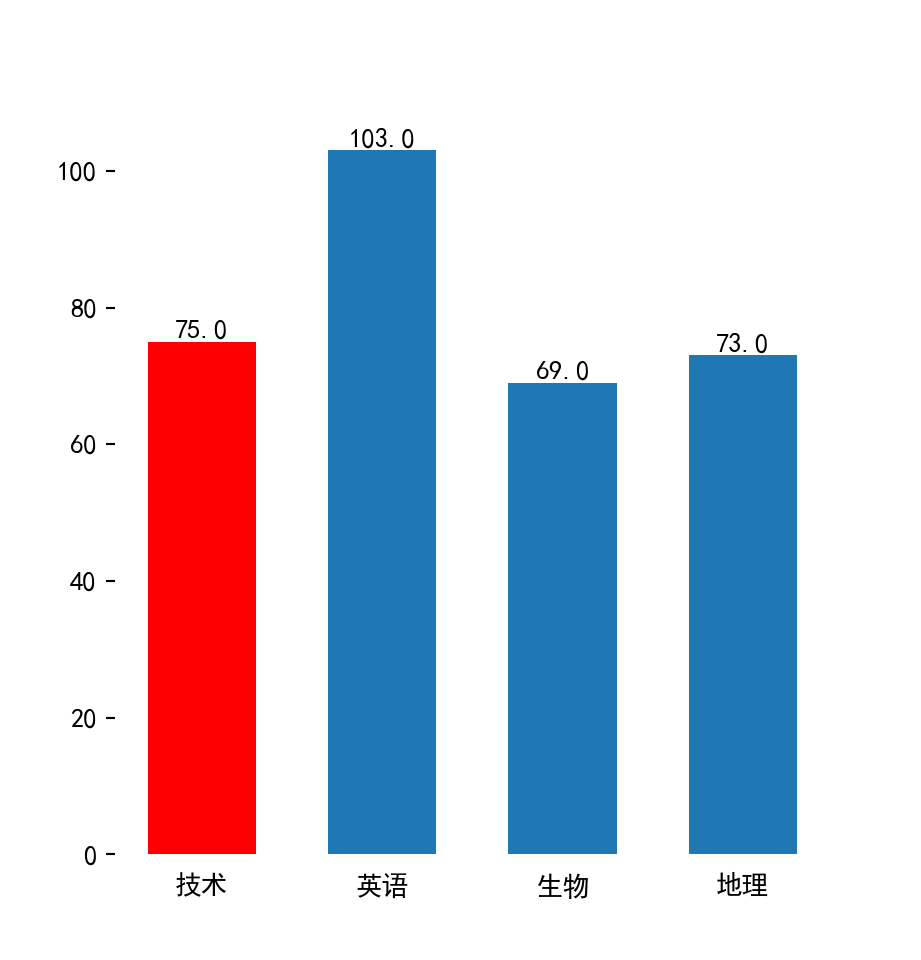
8.5.2 排列柱形图
比较两位同学同一次考试的各科成绩
two_student_score = chengji.query("mes_StudentID == [13539,13548] & exam_number == 284")[["mes_StudentID","mes_sub_name","mes_Score"]]
two_student_score
mes_StudentID mes_sub_name mes_Score
25373 13539 语文 53.0
25374 13548 语文 81.0
26481 13539 数学 50.0
26482 13548 数学 63.0fig,ax = plt.subplots(1,1)
ax1 = two_student_score.pivot(index="mes_sub_name",columns="mes_StudentID",values="mes_Score").plot(kind="bar",ax=ax)
for bar in ax.patches:
t = ax.text(bar.get_x()+1/2*bar.get_width(),bar.get_height(),bar.get_height(),ha="center",va="bottom")
ax.xaxis.set_tick_params(rotation=0)
t = ax.set_xlabel('学科')
t = ax.set_ylabel('成绩')
t = ax.legend(title="学生")
plt.show()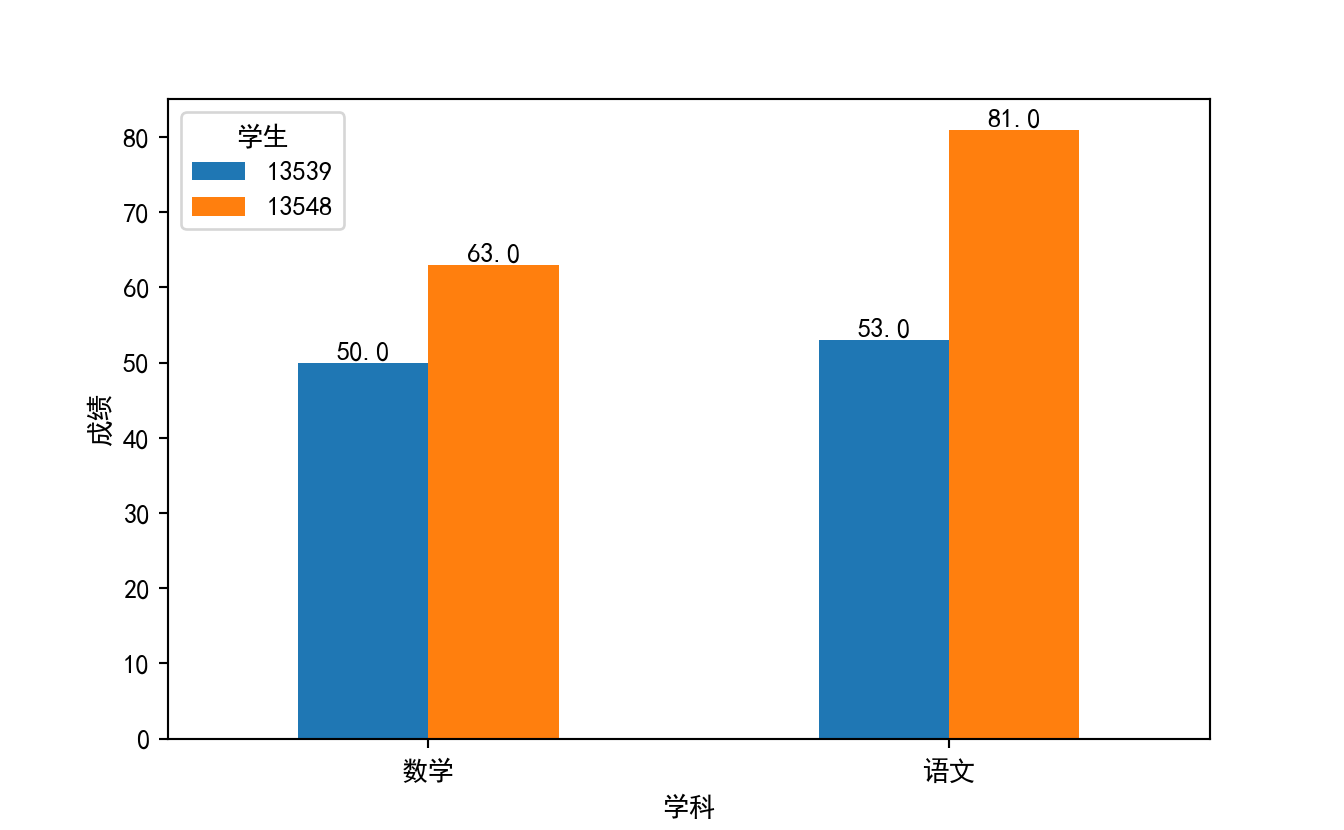
fig,ax = plt.subplots(1,1)
ax1 = sns.barplot(data=two_student_score,x="mes_sub_name",y="mes_Score",hue="mes_StudentID",ax=ax)
for bar in ax.patches:
    t = ax.text(bar.get_x()+1/2*bar.get_width(),bar.get_height(),bar.get_height(),ha="center",va="bottom")
ax.xaxis.set_tick_params(rotation=0)
t = ax.set_xlabel('学科')
t = ax.set_ylabel('成绩')
t = ax.legend(title="学生")
plt.show()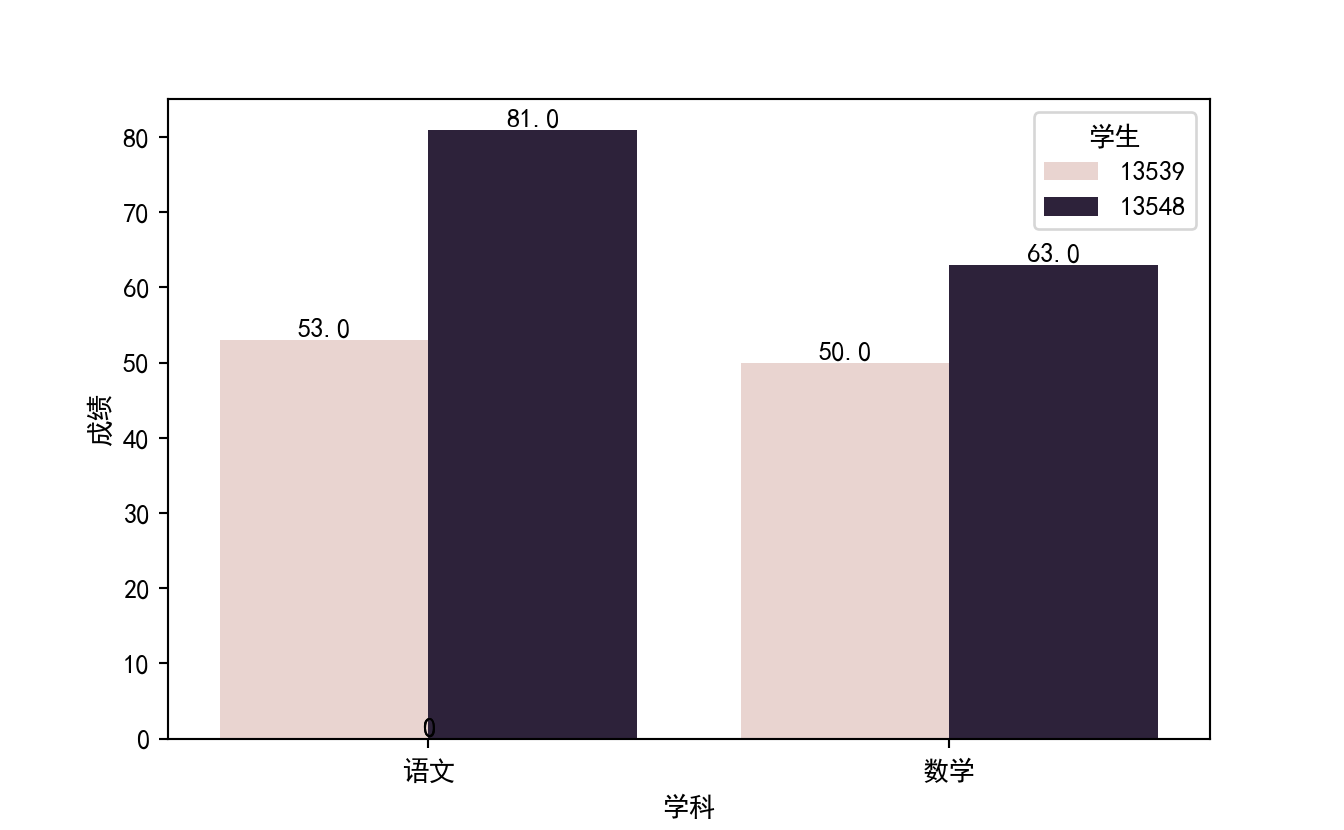
8.5.3 堆叠条形图
#我们要计算各个学生的总成绩
#横轴将变为学生,列将变成堆叠形式
fig,ax=plt.subplots(1,1)
student_sum_grade=two_student_score.pivot(index="mes_StudentID",columns="mes_sub_name",values="mes_Score")
ax1 = student_sum_grade.plot(kind="bar",ax=ax,stacked=True)
#改成绘制在顶端,这里需要计算cumsum,并且按照列展开,所以需要先转置
cums = student_sum_grade.apply(np.cumsum,axis=1).values.T.flatten()
for bar,height in zip(ax.patches,cums):
    t = ax.text(bar.get_x()+1/2*bar.get_width(),height,bar.get_height(),ha="center",va="top")
ax.xaxis.set_tick_params(rotation=0)
plt.show()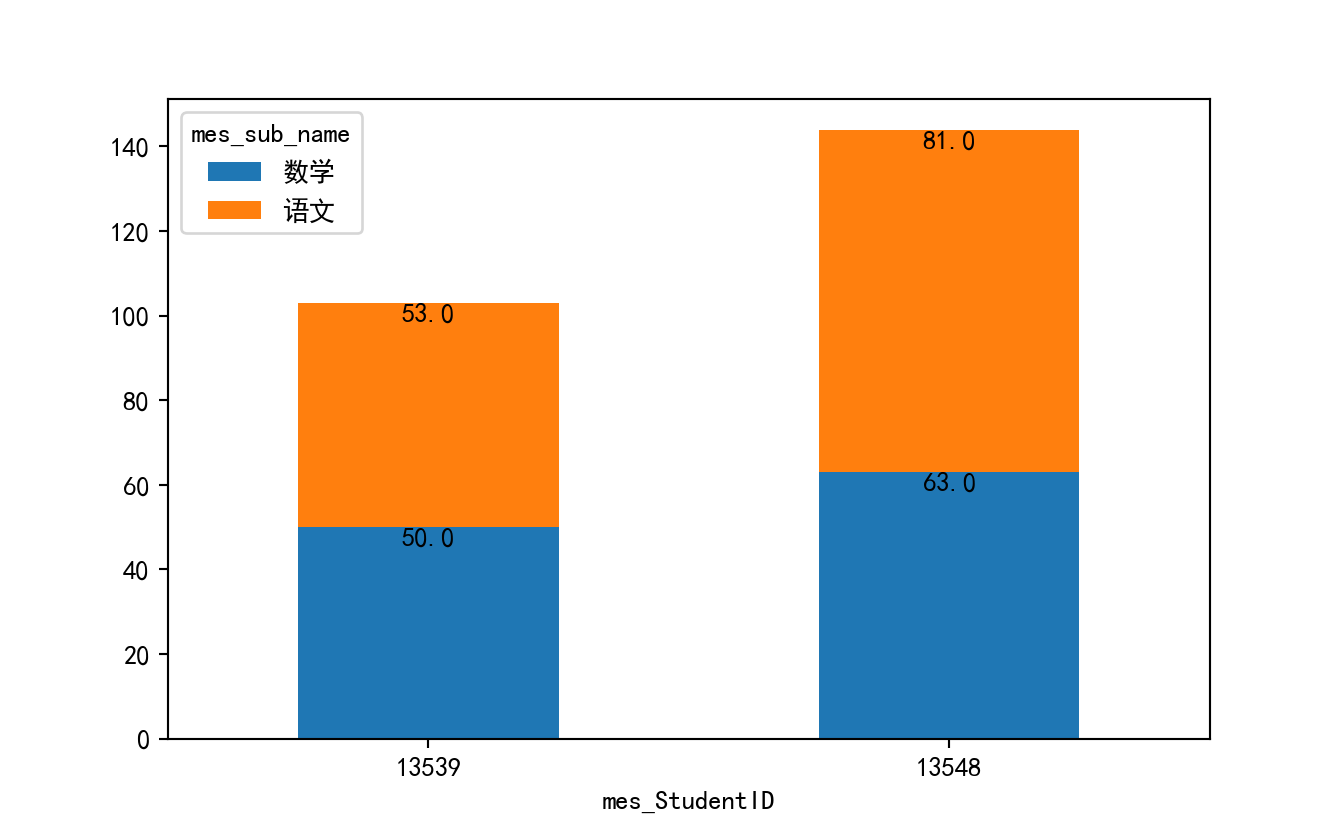
8.5.4 双向条形图
主要是bottom和left参数
#设计90分为及格线,绘制出一个班级的学生的数学成绩
class_student_math = pd.merge(student.query("cla_id == 901"),chengji.query("exam_number == 284 & mes_sub_name == '数学'" ),
         how="inner",left_on="bf_StudentID",right_on="mes_StudentID")[["bf_Name","mes_Score"]].set_index("bf_Name")
fig,ax = plt.subplots(figsize=(5,10))
#注意这里取序列求平均值
grade_mean = round(class_student_math.mes_Score.mean(),0)
mean_student_math = class_student_math - grade_mean
ax1 = mean_student_math.plot(kind="barh",width=0.5,ax=ax,left=grade_mean)
ax.xaxis.set_ticks_position("top")
ax.get_legend().set_visible(False)
t = ax.set_ylabel("")
t= ax.set_xlim(50,105)
for bar in ax.patches:
    tc = ax.text(bar.get_width()+grade_mean,bar.get_y()+bar.get_height()/2,
                 bar.get_width()+grade_mean,ha="right" if bar.get_width() < 0 else "left",va="center")
plt.show()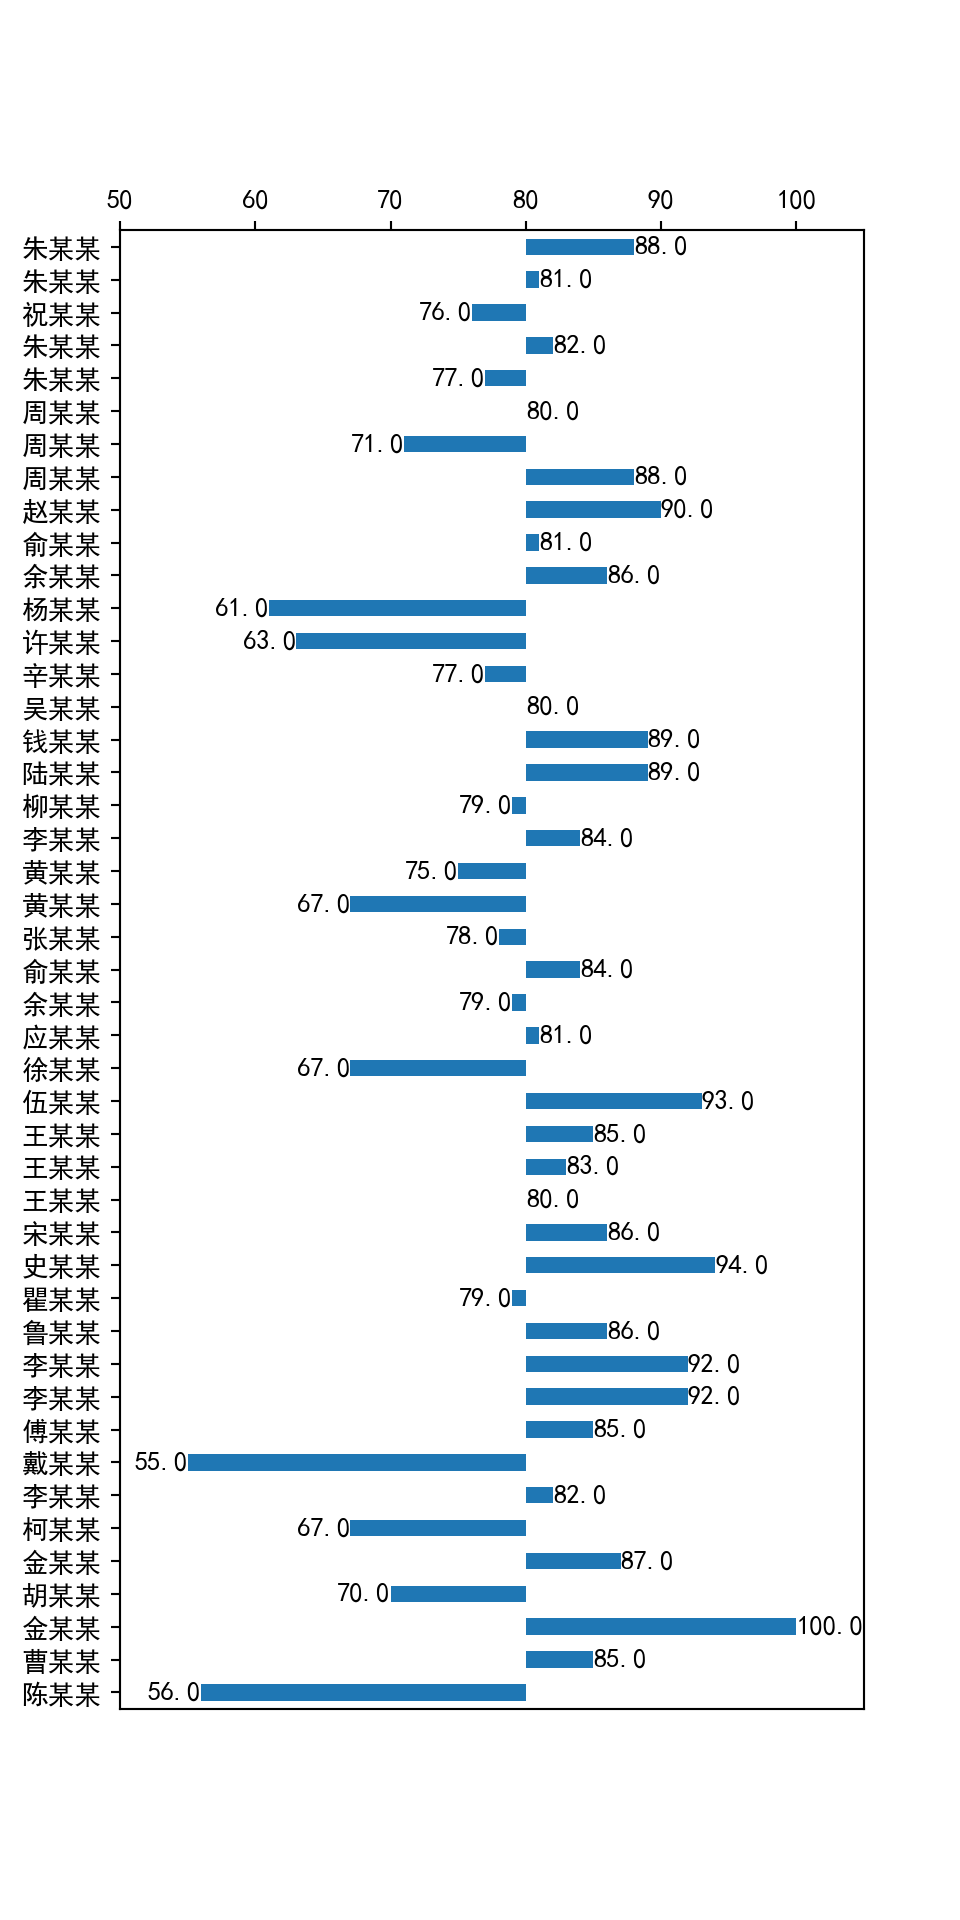
8.5.5 组合条形图
# 绘制多图
class_student_three = pd.merge(student.query("cla_id == 901"),chengji.query("exam_number == 284 & mes_sub_name == ['数学','英语','语文']"),
         how="inner",left_on="bf_StudentID",right_on="mes_StudentID").pivot(index="mes_sub_name",columns="bf_StudentID",values="mes_Score")
#返回axes的集合
axs = class_student_three.plot(
    kind = "bar",
    subplots = True,
    layout = (5,-1),
    figsize = (8,6),
    width = 0.9,
    xlabel = "",
    ylabel = "",
    legend = False
)
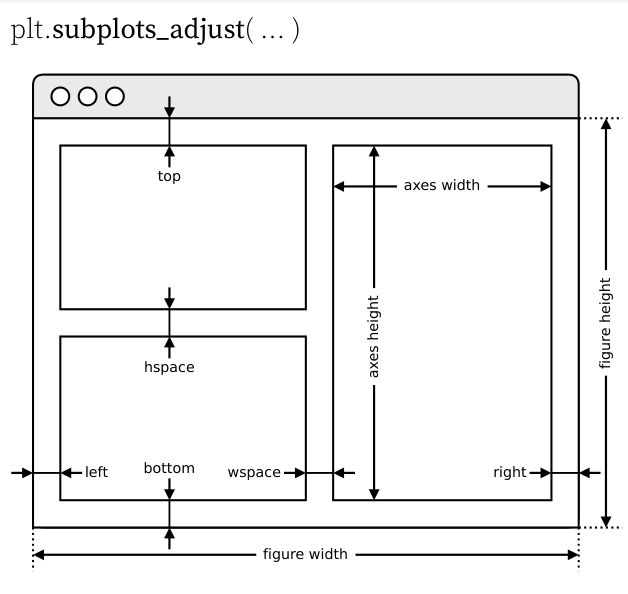
plt.subplots_adjust(wspace=0.5,hspace=0.5)
mean = class_student_three.apply(np.mean,axis=1).values.flatten()
for ax in axs.flatten():
    ax.set_axis_off()
    ax.title.set_fontsize(10)
    #ax.get_legend().set_visible(False)
    #低于平均分为灰色,其他为黑色
    for m,patch in zip(mean,ax.patches):
        patch.set_facecolor("grey" if patch.get_height()<m else "black")
grey_patch = mpatches.Patch(color="grey")
black_patch = mpatches.Patch(color="black")
plt.legend(handles=[grey_patch,black_patch],labels=["低于均分","不低于均分"],ncols=2,bbox_to_anchor=(1,8))
plt.show()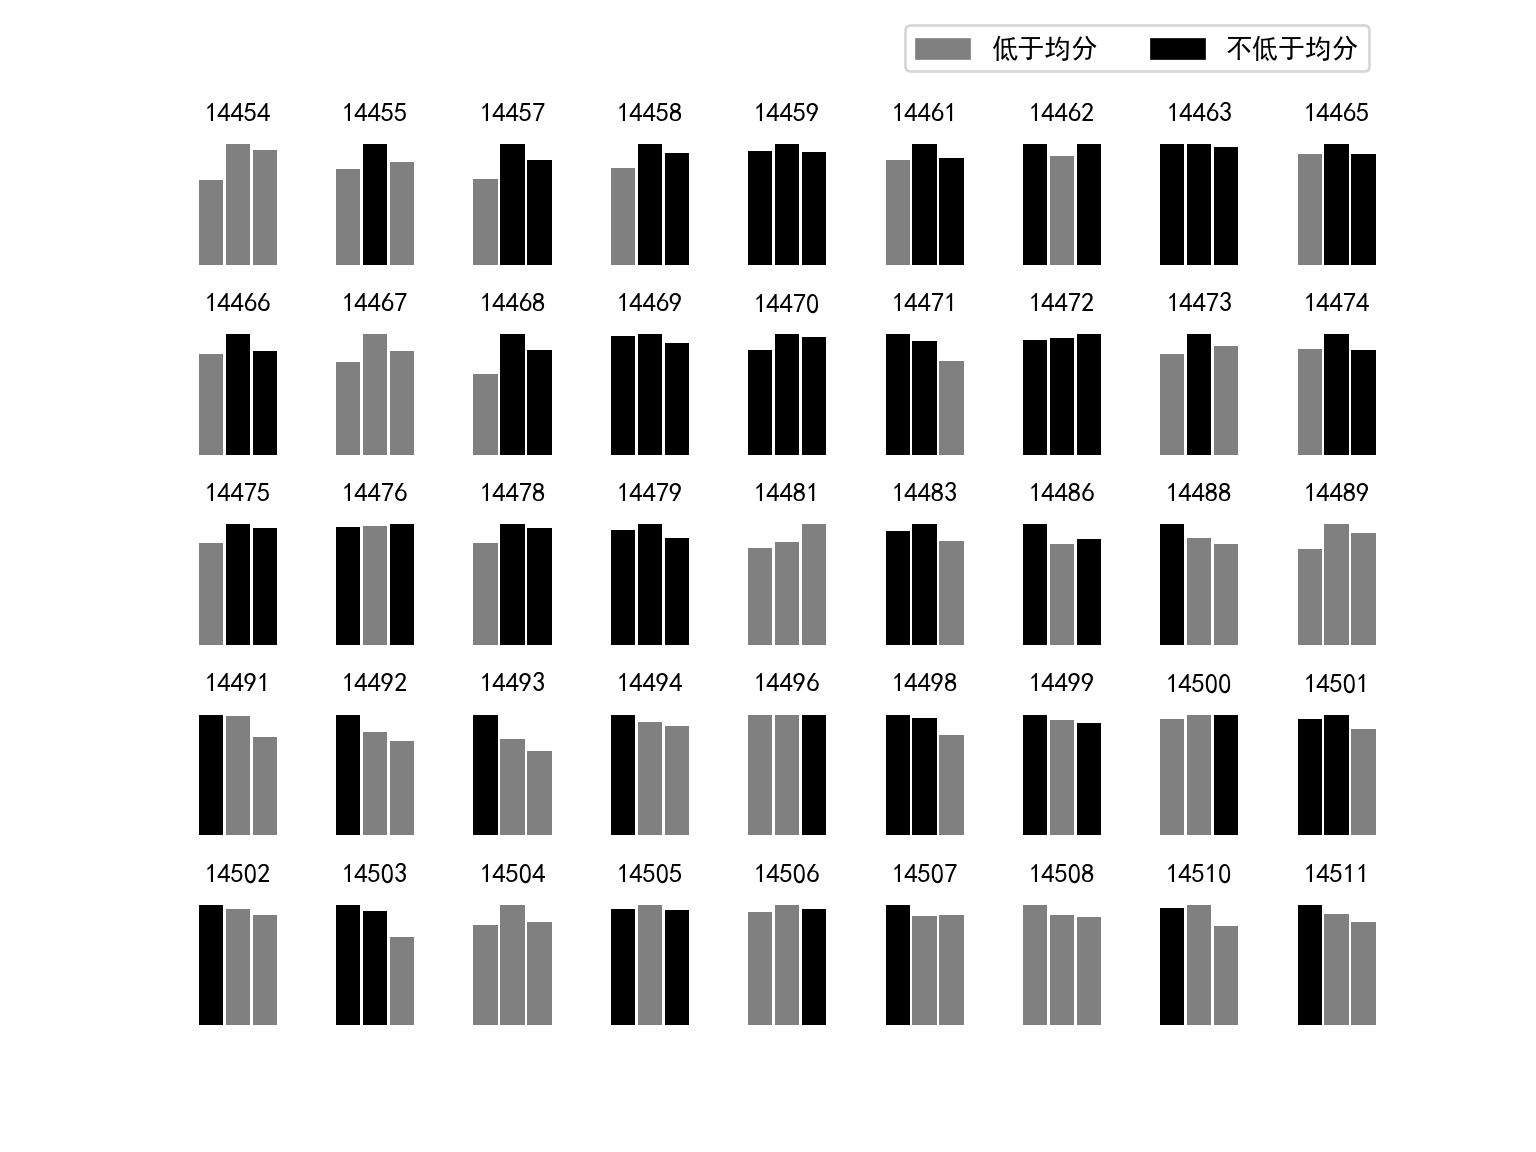
# 要想在某个可调用的fig下绘制,可以指定ax=某个多图的ax集合,但是layout参数就不能使用了
fig,axc= plt.subplots(5,9,figsize=(8,6))
axs = class_student_three.plot(
    kind = "bar",
    subplots = True,
    #layout = (5,-1),
    #figsize = (8,6),
    width = 0.9,
    xlabel = "",
    ylabel = "",
    legend = False,
    ax = axc
)
fig.subplots_adjust(wspace=0.5,hspace=0.5)
mean = class_student_three.apply(np.mean,axis=1).values.flatten()
for ax in axs.flatten():
    ax.set_axis_off()
    ax.title.set_fontsize(10)
    #低于平均分为灰色,其他为黑色
    for m,patch in zip(mean,ax.patches):
        patch.set_facecolor("grey" if patch.get_height()<m else "black")
grey_patch = mpatches.Patch(color="grey")
black_patch = mpatches.Patch(color="black")
fig.legend(handles=[grey_patch,black_patch],labels=["低于均分","不低于均分"],ncols=2,bbox_to_anchor=(0.9,1))
t = fig.suptitle("某班学生语数英成绩对比",x=0.15,y=0.95,va="bottom",ha="left")
plt.show()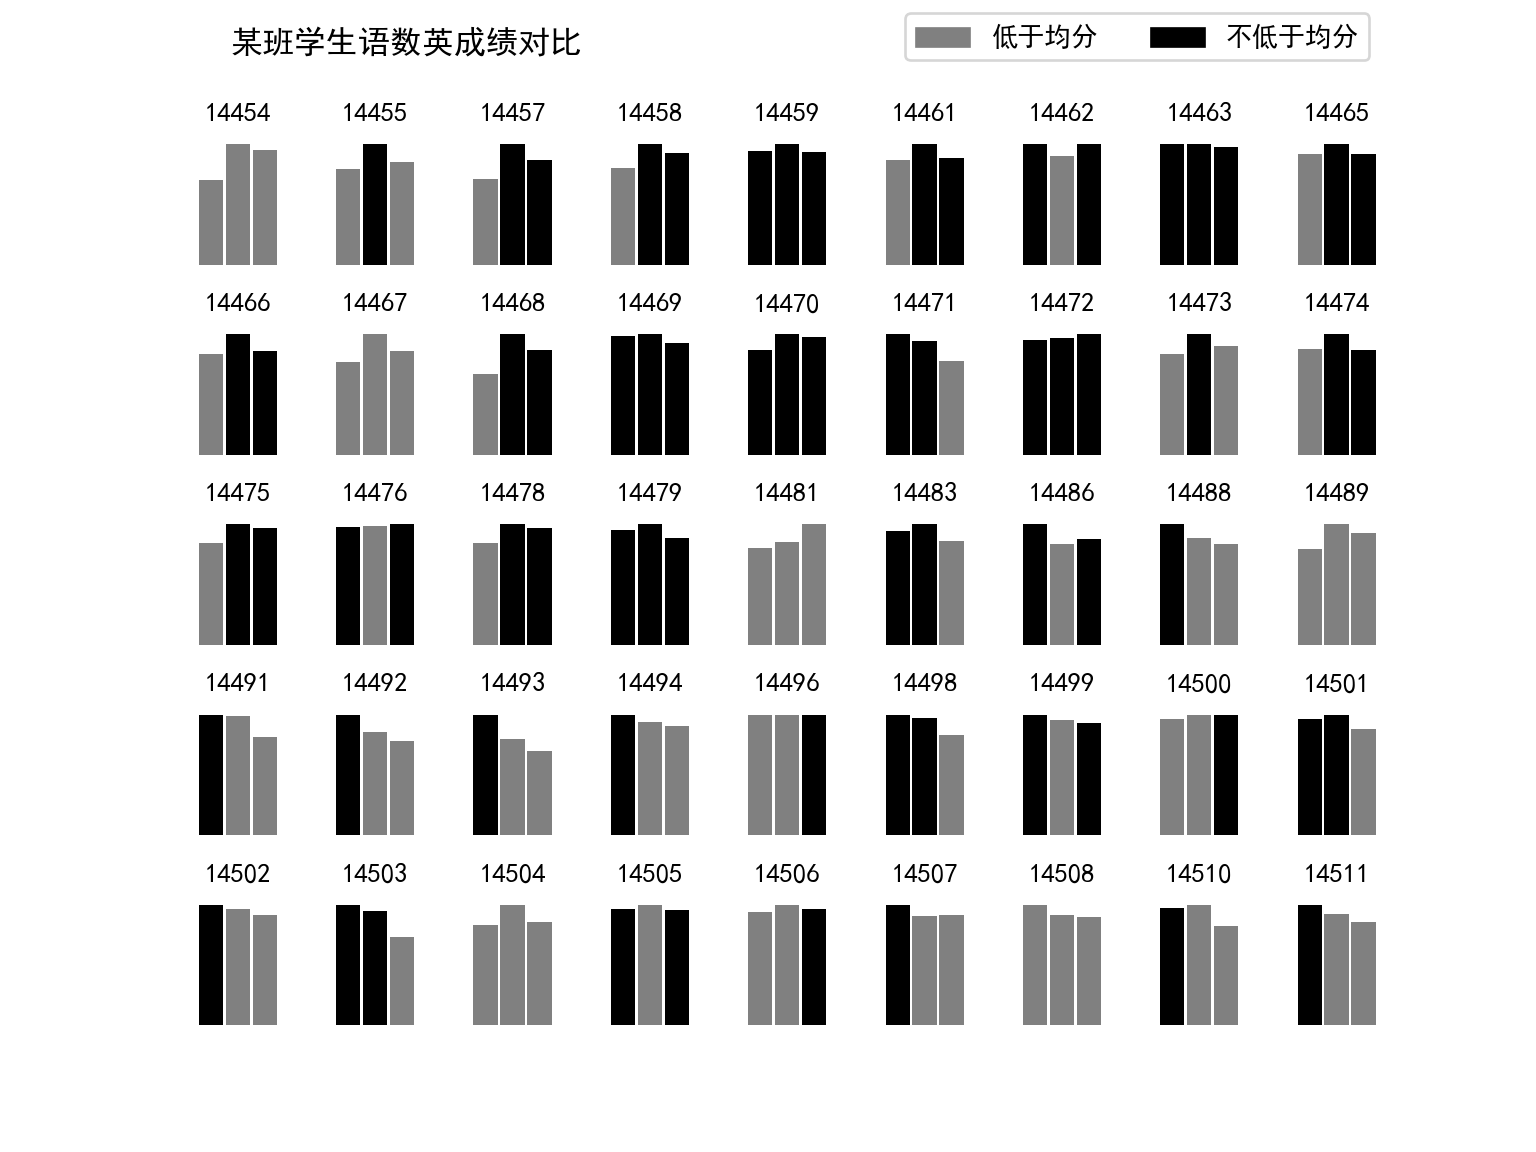
8.6 折线图
line, = plt.plot() 是为了将返回的列表类型给解包,变成单个对象
8.6.1 基础折线图
# 一个学生各科历次考试成绩变化,只取期中,期末和五校的三门主课成绩
a_student_grade = chengji.query("mes_StudentID  == 14933 & exam_type == [2,3,6]").query("mes_sub_name == ['语文','数学','英语']").sort_values(["exam_number"]).dropna(subset=["mes_Score"])[["exam_number","exam_sdate","mes_sub_name","mes_Score"]]
a_student_grade["exam_sdate"] = pd.to_datetime(a_student_grade.exam_sdate).dt.date #如果不加后面的提取日期是时间类型,加了则不是
exam_subject_score = a_student_grade.pivot(index="exam_number",columns="mes_sub_name",values="mes_Score").applymap(int)
<string>:1: FutureWarning: DataFrame.applymap has been deprecated. Use DataFrame.map instead.mes_sub_name 数学 英语 语文
exam_number
284 53 77 65
288 78 124 81
292 63 75 68
298 67 106 91
304 78 79 57et_subject_score = a_student_grade.pivot(index="exam_sdate",columns="mes_sub_name",values="mes_Score").applymap(int)<string>:2: FutureWarning: DataFrame.applymap has been deprecated. Use DataFrame.map instead.mes_sub_name 数学 英语 语文
exam_sdate
2017-11-15 53 77 65
2018-01-26 78 124 81
2018-04-23 63 75 68
2018-06-24 67 106 91
2018-11-05 78 79 57fig,ax = plt.subplots(1,1)
ls = exam_subject_score.plot(
# fmt: 该关键字不能写,直接写值。"[marker][line][color]"
# 如果没有marker,有line,则是一条线,无点,
# 比如直接写".-r",不要写fmt=".-r"
mec = "r", # markeredgecolor
mew = 2, # markeredgewidth
mfc = 'black',# markerfacecolor='red',#marker填充色
ms = 5, # markersize='15',#marker大小
lw = 2,
ls = '--',
marker='^',#marker形状
fillstyle='top',#marker填充形式,可选{'full', 'left', 'right', 'bottom', 'top', 'none'}
markerfacecoloralt='blue',#marker未被填充部分颜色
markevery=2,#每隔一个画一个marker
# label='',#图例
alpha=0.8,#线和marker的透明度
ax = ax
)
#如果类别以数值表示的话,它的tick的interval会发生根据数值差发生变化
ax.xaxis.set_major_locator(ticker.FixedLocator(exam_subject_score.index))
# 添加标签
for i,ds in exam_subject_score.iterrows():
for d in ds:
t = ax.text(i,d,d,va="bottom",ha="center")
plt.show()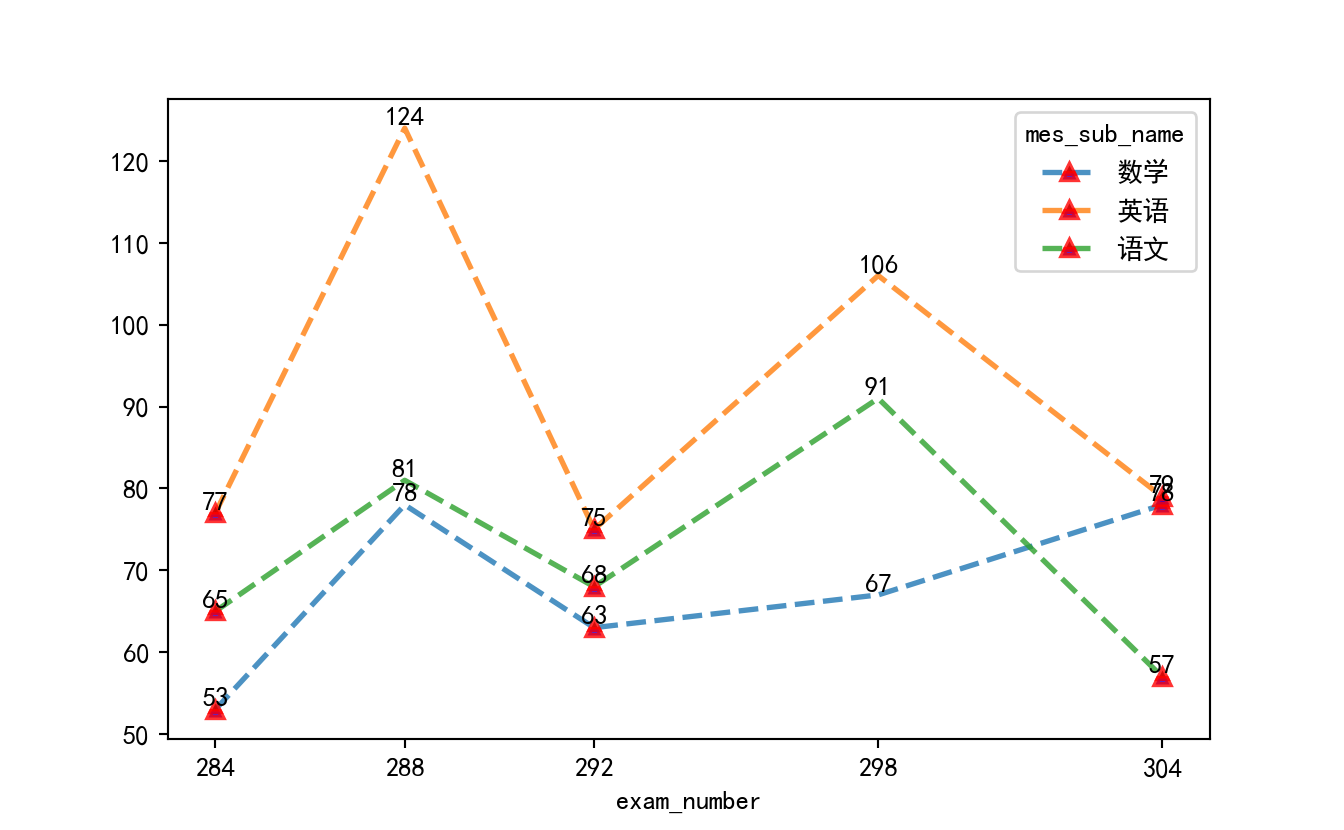
ax = et_subject_score.plot(subplots=[("数学","语文"),("英语",)],layout=(1,2),figsize=(10,5))
t = ax[0,0].set_xlabel("exam_time")
plt.show()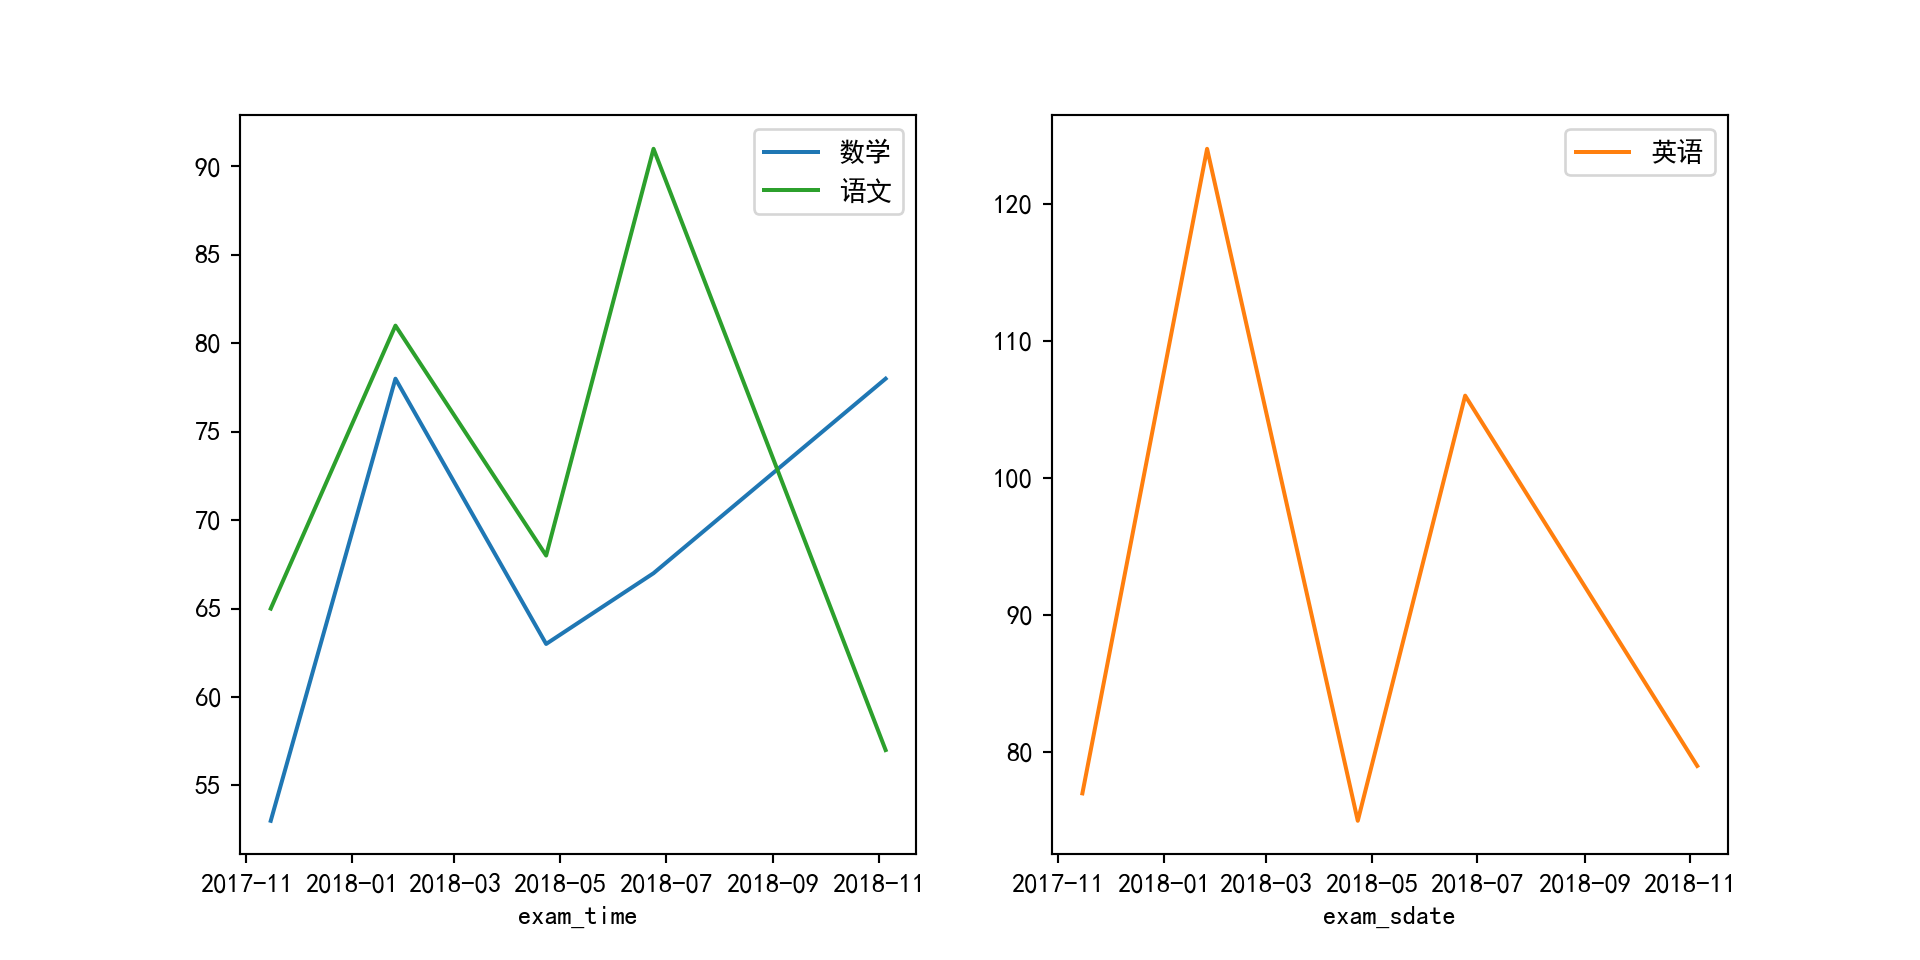
8.7 直方图
n, bins, patches=plt.hist()
plt.xticks(bins)#x轴刻度设置为箱子边界
8.7.1 基础直方图
class_student_math.plot(kind="hist",
##箱子数(bins)设置,以下三种不能同时并存
#bins=20,#default: 10
#bins=[4,6,8],#分两个箱子,边界分别为[4,6),[6,8]
#bins='auto',# 可选'auto', 'fd', 'doane', 'scott', 'stone', 'rice', 'sturges', or 'sqrt'.
#选择最合适的bin宽,绘制一个最能反映数据频率分布的直方图

#range=(5,7),#最左边和最右边箱子边界,不指定时,为(x.min(), x.max())
#density=True, #默认为False,y轴显示频数;为True y轴显示频率,频率统计结果=该区间频数/(x中总样本数*该区间宽度)
#weights=np.random.rand(len(x)),#对x中每一个样本设置权重,这里随机设置了权重
cumulative=False,#默认False,是否累加频数或者频率,及后面一个柱子是前面所有柱子的累加
bottom=0,#设置箱子y轴方向基线,默认为0,箱子高度=bottom to bottom + hist(x, bins)
histtype='bar',#直方图的类型默认为bar{'bar', 'barstacked', 'step', 'stepfilled'}
align='mid',#箱子边界值的对齐方式,默认为mid{'left', 'mid', 'right'}
orientation='vertical',#箱子水平还是垂直显示,默认垂直显示('vertical'),可选'horizontal'
rwidth=1.0,#每个箱子宽度,默认为1,此时显示50%
log=False,#y轴数据是否取对数,默认不取对数为False
label='sepal length(cm)',#图例
#normed=0,#功能和density一样,二者不能同时使用
facecolor='blue',#箱子颜色
edgecolor="black",#箱子边框颜色
stacked=False,#多组数据是否堆叠
alpha=0.5#箱子透明度
)
plt.show()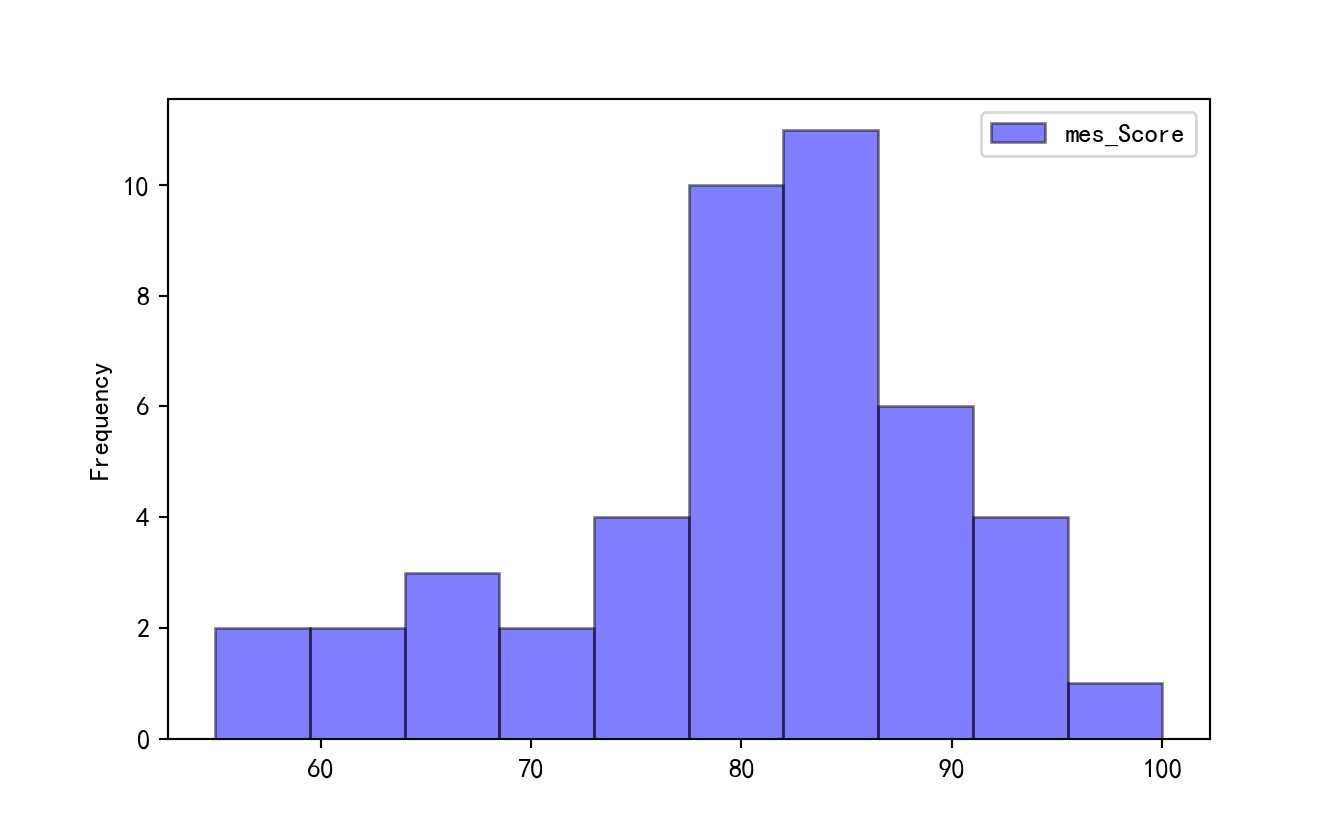
8.7.2 组合直方图
 # 某班级三次考试中数学成绩的变化
class_three_math = pd.merge(student.query("cla_id == 901"),
         chengji.query("exam_number == [284,289,292] & mes_sub_name == '数学'" ),
         how="inner",
         left_on="bf_StudentID",
         right_on="mes_StudentID").pivot(index="bf_StudentID",columns="exam_number",values="mes_Score")
# 绘制图片,axs是axes的array
axs = class_three_math.plot(
    kind = "hist",
    bins = 10,
    subplots = True,
    layout = (1,3),
    orientation = "horizontal",
    color = "grey",
    ylim = (50,100),
    figsize = (10,6),
    title = "某班级连续三次考试数学成绩对比",
    sharey = True
)

#参数设置
for ax in axs.flatten():
    ax.get_legend().set_visible(False)
    for spine in ax.spines.values():
        spine.set_visible(False)
    ax.xaxis.set_ticks_position("none")
    ax.xaxis.set_major_locator(ticker.FixedLocator([10,20]))
    t = ax.set_xlabel("")
    for tl in ax.yaxis.get_ticklines():
        tl.set_visible(False)

xl = axs[0,0].set_xlim(-5,30)

#计算均值并标记
mean  = round(class_three_math.apply(np.mean),1).values.flatten()
for i,m in enumerate(mean):
    l = axs[0,i].plot([20],[m],'.k')
    t = axs[0,i].text(20+2,m,m,va="center",ha="left")

plt.show()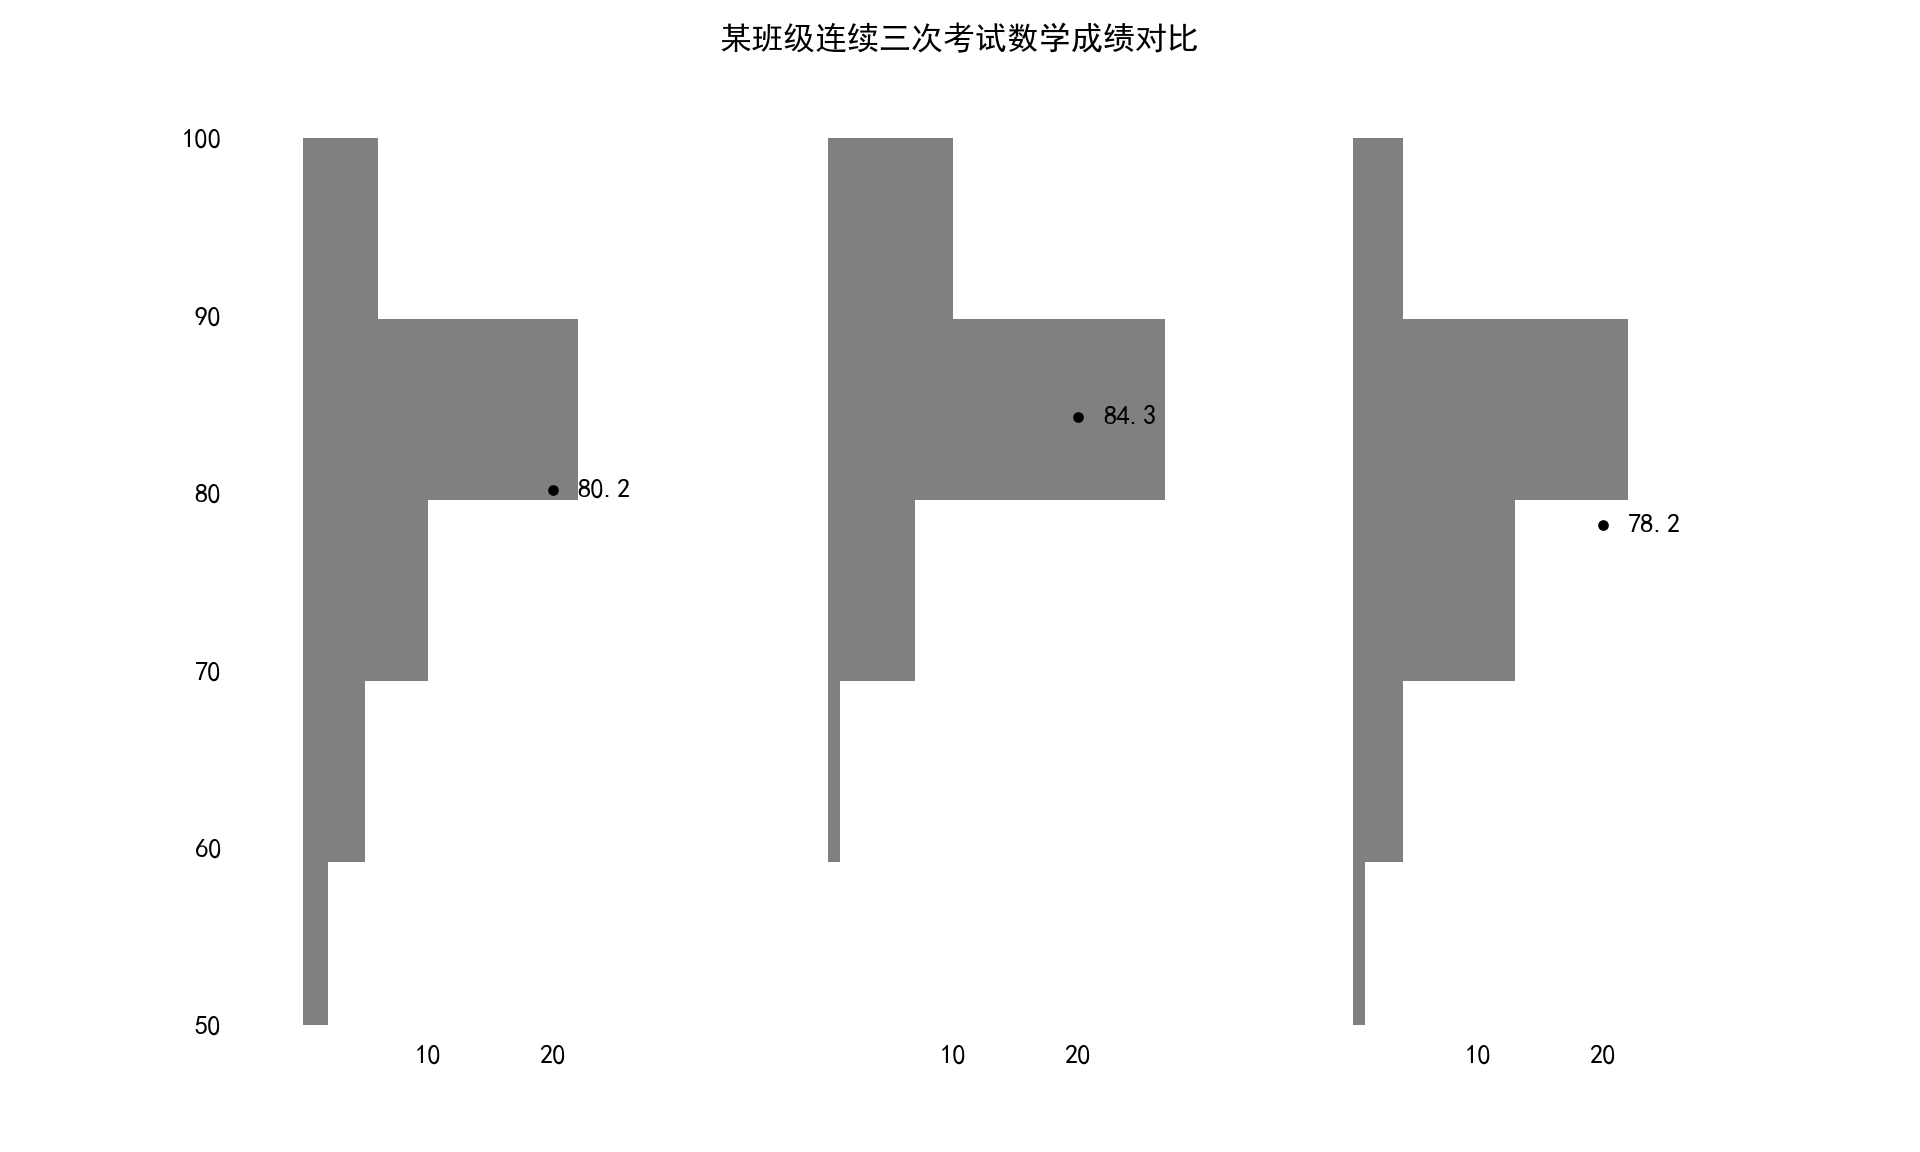
8.8 箱线图
plt.boxplot()返回dict
dict
  A dictionary mapping each component of the boxplot to a list
  of the `.Line2D` instances created. That dictionary has the
  following keys (assuming vertical boxplots):

  - ``boxes``: the main body of the boxplot showing the
    quartiles and the median's confidence intervals if
    enabled.

  - ``medians``: horizontal lines at the median of each box.

  - ``whiskers``: the vertical lines extending to the most
    extreme, non-outlier data points.

  - ``caps``: the horizontal lines at the ends of the
    whiskers.

  - ``fliers``: points representing data that extend beyond
    the whiskers (fliers).

  - ``means``: points or lines representing the means.
8.8.1 获取返回数据
class_student_grade = pd.merge(student.query("cla_id == 901"),chengji.query("exam_number == 284"),
         how="inner",left_on="bf_StudentID",right_on="mes_StudentID")[["bf_StudentID","mes_sub_name","mes_Score"]].pivot(index="bf_StudentID",columns="mes_sub_name",values="mes_Score")

point = plt.boxplot(
    x = "数学",
    data = class_student_grade[["数学"]]
)
point["fliers"][0].get_ydata()
array([ 56., 63., 61., 55., 100.])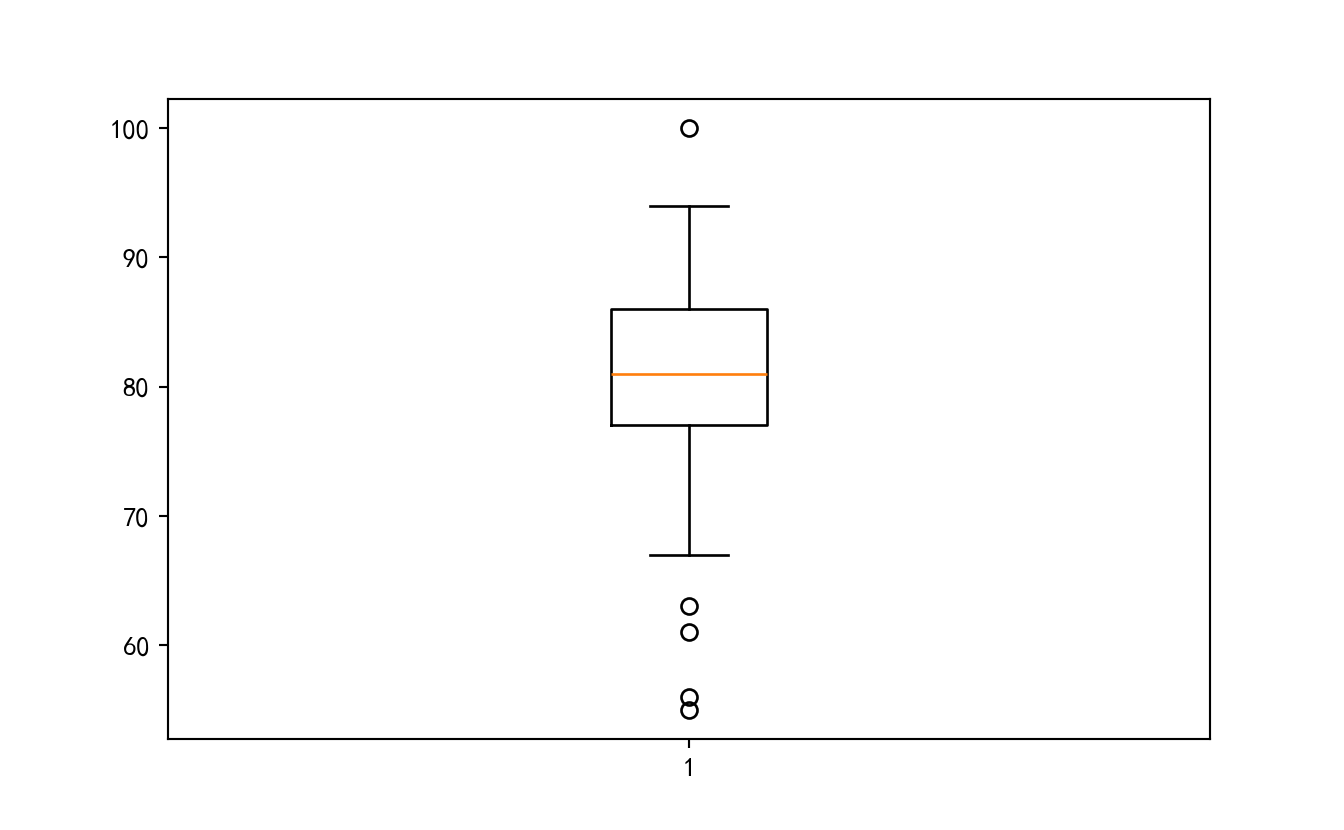
8.8.2 组合箱线图
# 一个班某一次考试各科成绩的箱线图
point = class_student_grade.boxplot(
  whis = 1.5, # 指定1.5倍的四分位差
  widths = 0.7, # 指定箱线图的宽度为0.8
  patch_artist = True, # 指定需要填充箱体颜色
  showmeans = True, # 指定需要显示均值
  boxprops = {'facecolor':'steelblue'}, # 指定箱体的填充色为铁蓝色
  flierprops = {'markerfacecolor':'red', 'markeredgecolor':'red', 'markersize':4},#  指定异常点的填充色、边框色和大小
  meanprops = {'marker':'D','markerfacecolor':'black', 'markersize':4},# 指定均值点的标记符号(菱形)、填充色和大小
  medianprops = {'linestyle':'--','color':'orange'},#指定中位数的标记符号(虚线)和颜色
  #labels = [''] # 去除箱线图的x轴刻度值
  vert = True,#默认绘制垂直箱线图
  return_type = "dict",#确定返回类型,“dict,axes,both(ax,lines)”
)
plt.show()
plt.close()
#获取异常点值
for p in point["fliers"]:
    print(p.get_ydata())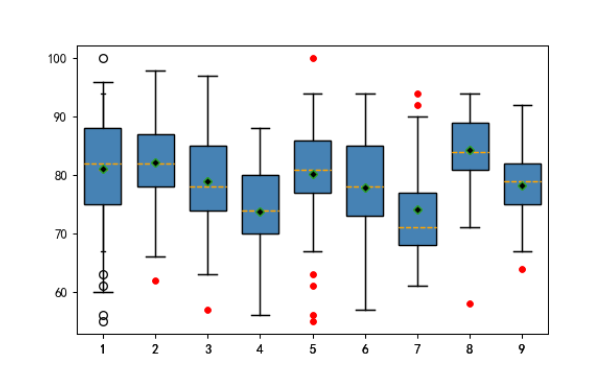
8.9 饼图
8.9.1 基础饼图
返回每个扇,label和autotext(百分比)
# 一个学生各科成绩的占比
patches,texts,autotexts = plt.pie(
    data=sub_score,
    x = "mes_Score",#数值
    labels = "mes_sub_name",#标签名
    colors=["#d5695d","#5d8ca8","#65a479","#72384f"],#修改饼图颜色,传入颜色list
    explode=(0.2, 0,0, 0),#某部分突出显示,值越大,距离中心越远,该法可解决饼图字体重叠的问题
    autopct='%.1f%%',#格式化输出百分比
    pctdistance=0.8,#百分比标签与圆心的距离
    labeldistance=1.1,#labels与圈边界的距离,默认为1.1
    startangle=45,#饼图的开始角度,默认为0度,为数学意义上的象限的0度,根据旋转方向旋转对应角度
    radius=1.3,#饼图半径,默认为1
    counterclock=False,#关闭逆时针显示
    #设置框属性
    wedgeprops={'edgecolor':'r',#内外框颜色
                'linestyle':'--',#线型
                'alpha':0.5,#透明度
                #更多参考matplotlib.patches.Wedge
               },
            #饼图中文本的属性
    textprops={'color':'r',#文本颜色
               'fontsize':16,#文本大小
               'fontfamily':'Microsoft JhengHei',#设置微软雅黑字体
               #更多参考matplotlib.pyplot.text
              }
)
patches[0].set_facecolor('red')#设置第一个弧形块的颜色
texts[0].set_size(40)#设置第一个标签的大小
autotexts[0].set_color('white')#修改第一个百分比的颜色
plt.show()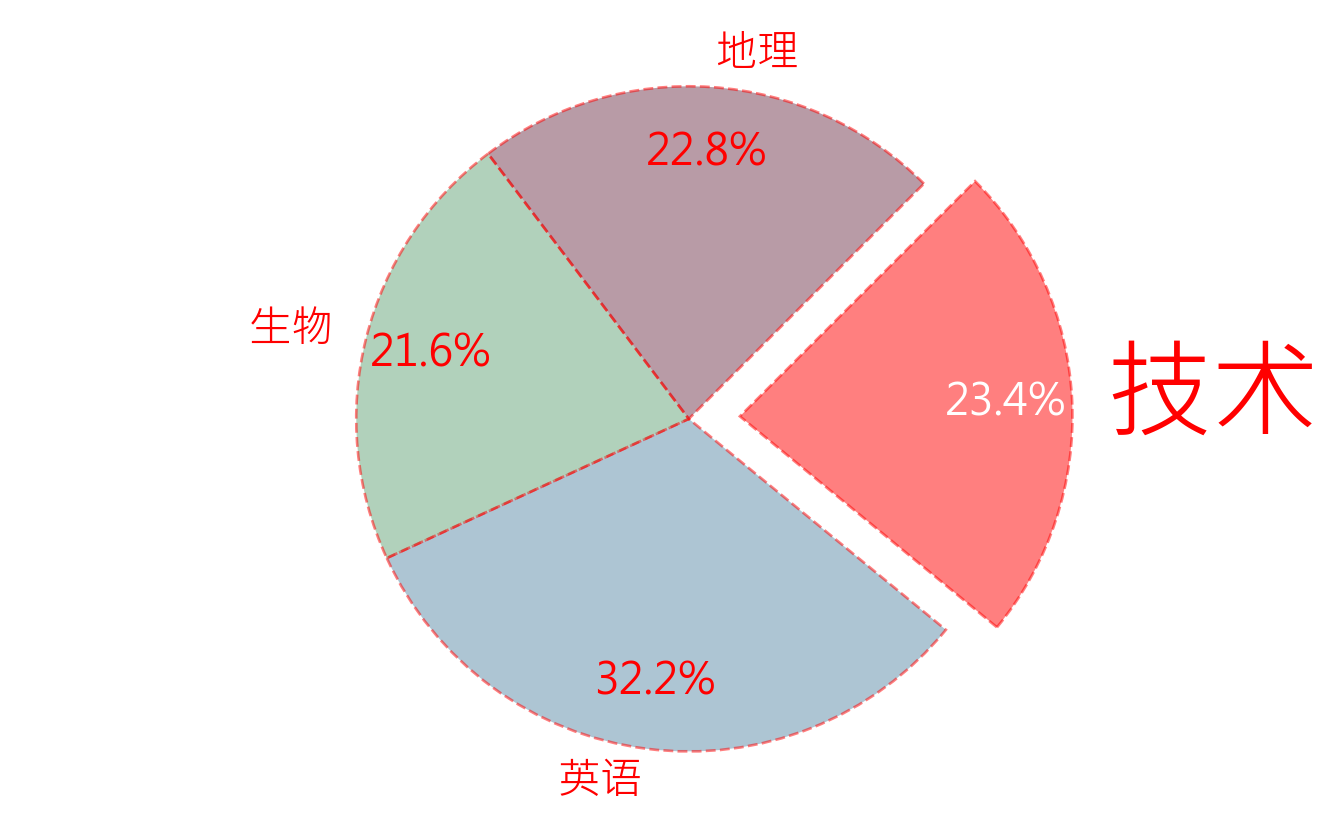
8.9.2 玫瑰图
结合极坐标
# 不同长度rad的极坐标柱形图
#设置theta,rad,width,colors
fig,ax = plt.subplots(1,1,layout='constrained',subplot_kw={'projection':"polar"})
theta = np.pi*np.linspace(0,2,len(class_student_math)+1)[:-1]
line,label = ax.set_thetagrids(theta*180/np.pi,class_student_math.index,ha="center",va="top",fontsize=10)
#ax.set_rlabel_position()
#ax.grid(False)
rad = class_student_math.sort_values("mes_Score",ascending=False).mes_Score
width = 2*np.pi/len(class_student_math)
#颜色利用数值归一化后传入
ax.bar(theta,rad,width=width, bottom=0.0,alpha=0.8,color=plt.cm.viridis((rad-rad.min())/(rad.max()-rad.min())))
#color=plt.cm.viridis((rad-rad.min())/(rad.max()-rad.min())*256)
#,edgecolor="white"
ax.set_theta_zero_location('N')         #设置极轴方向
#t = ax.set_rticks([])
ax.set_axis_off()
for t,v,l in zip(theta,rad,rad.index):
    nt = ax.text(t,v,str(l)+"\n"+str(v),ha="center",va="center",fontsize=8,rotation=t*180/np.pi,color="black",fontfamily="KaiTi")
plt.show()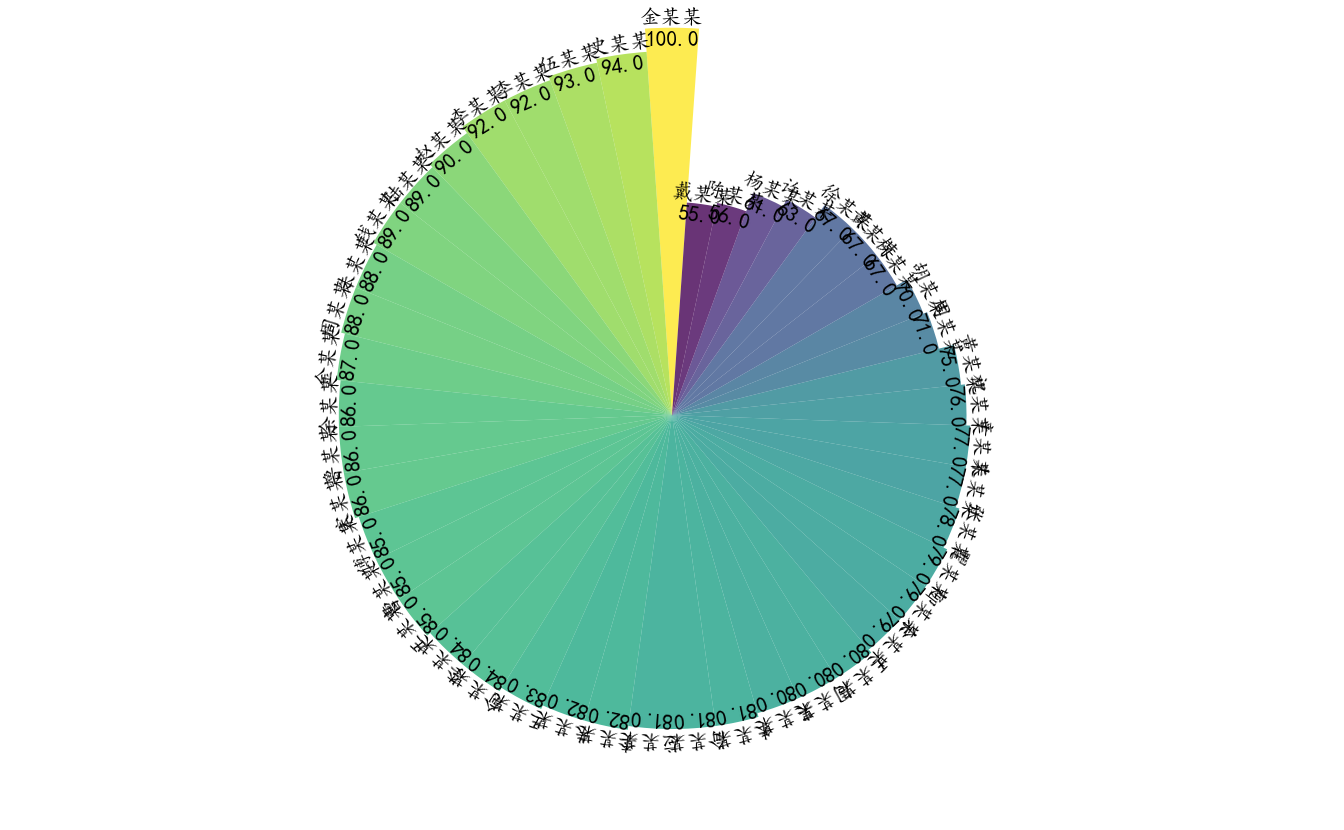
8.10 散点图
8.10.1 基础散点图
scatter_data = pd.DataFrame(
    {
        "x":np.random.randint(1,10,36),
        "y":np.random.randint(1,10,36),
        "c":np.random.permutation(['a','b','c','d']*9),
        "s":np.random.permutation([5,10,15,20,25,30]*6),
        "m":np.random.permutation(["one","two"]*18)
    }
)
plt.scatter(
    data = scatter_data,
    x = "x",
    y = "y",
    s = "s",
    c = scatter_data.c.map({"a":"red","b":"blue","c":"yellow","d":"green"}),
    #marker = ,marker形状,如果想要绘制不同的形状,则需要利用循环
    #marker=matplotlib.markers.MarkerStyle(marker = markers[i],fillstyle='full'),#设置marker的填充
    alpha=0.8,#marker透明度,范围为0-1
    facecolors='r',#marker的填充颜色,当上面c参数设置了颜色,优先c
    edgecolors='none',#marker的边缘线色
    linewidths=1,#marker边缘线宽度,edgecolors不设置时,改参数不起作用
    #label = 后面图例的名称取自label
)
plt.show()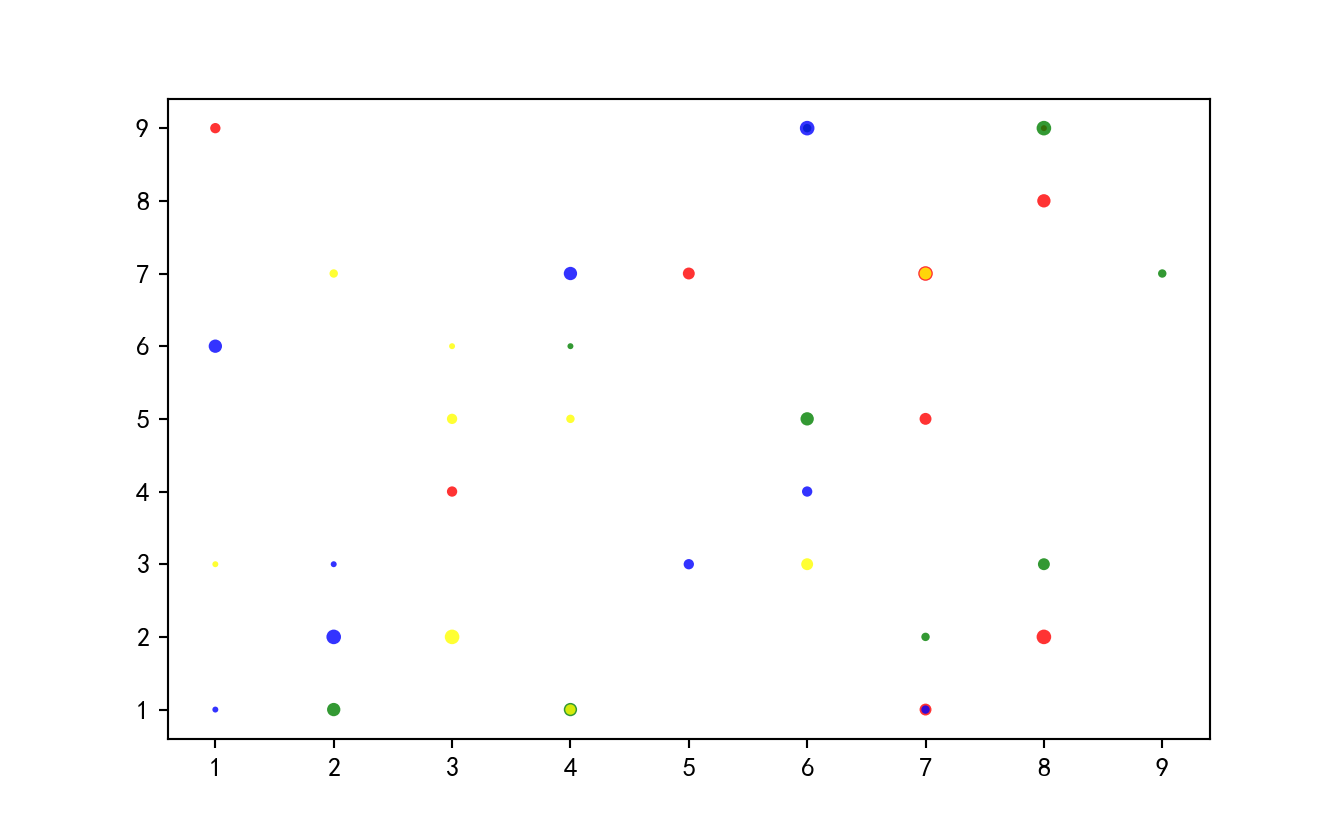
8.10.2 不同形状的散点
fig,ax = plt.subplots(1,1)
mark = {"one":".","two":"*"}
#不要colorbar
#markersize的比较合适大小在100左右
#利用cmap将color中的数值映射到颜色
for m,md in scatter_data.groupby("m"):
    p = md.plot(
    kind="scatter",
    marker = mark[m],
    x = "x",
    y = "y",
    s = 10*md.s,
    c = md.s,
    cmap = mpl.cm.viridis,
    #marker = ,marker形状,如果想要绘制不同的形状,则需要利用循环
    #marker=matplotlib.markers.MarkerStyle(marker = markers[i],fillstyle='full'),#设置marker的填充
    alpha=0.8,#marker透明度,范围为0-1
    facecolors='r',#marker的填充颜色,当上面c参数设置了颜色,优先c
    edgecolors='none',#marker的边缘线色
    linewidths=1,#marker边缘线宽度,edgecolors不设置时,改参数不起作用
    #label = 后面图例的名称取自label
    colorbar = False,
    ax=ax,
    )
plt.show()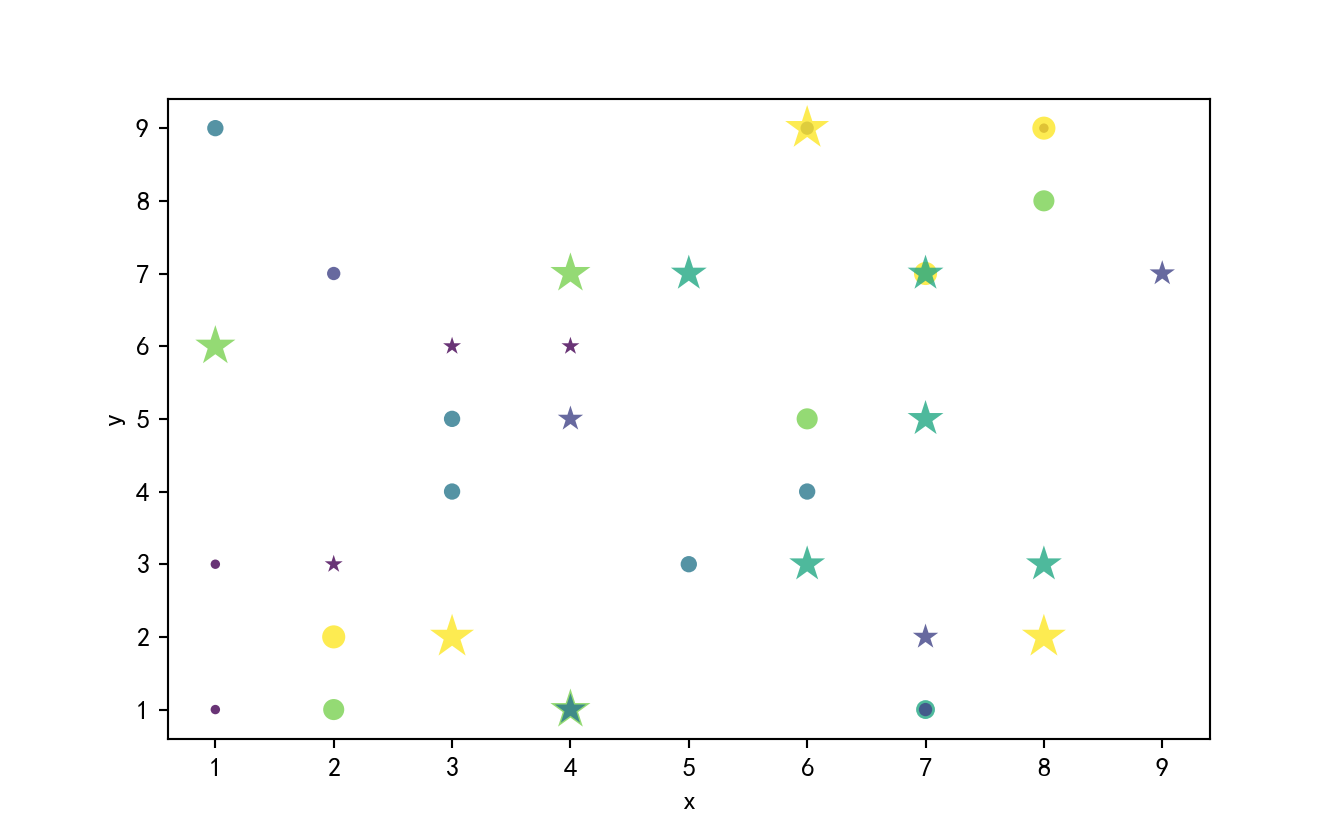
8.11 极坐标
#创建极坐标
fig = plt.figure()
ax = fig.add_subplot(polar=True)
#创建极坐标
fig,ax = plt.subplots(subplot_kw={'projection':"polar"})
8.11.1 基础极坐标
fig = plt.figure()
ax = fig.add_subplot(polar=True)
fig.clear()
#创建极坐标图
fig,ax = plt.subplots(subplot_kw={'projection':"polar"})
#绘制点图,即雷达图,只需确定几等分,以及label即可
#获取两位同学的某次考试各科成绩
two_student = chengji.query("mes_StudentID == [13543,13544] & exam_number == 288 & mes_Score >0").pivot(index="mes_sub_name",columns="mes_StudentID",values="mes_Score")
#这里要多生成一个角度,因为0,2pi是一样的位置
theta = np.linspace(0,2*np.pi,len(two_student)+1)[:-1]
name = two_student.index
tn = ax.set_thetagrids(theta*180/np.pi,name)         #替换轴线和标签
s1, = ax.plot(theta,two_student.iloc[:,0],'.m')
s2, = ax.plot(theta,two_student.iloc[:,1],'.g')
ax.set_rmax(160)
t = ax.set_rticks([20,40,60,80,100,120,140,160])  # Less radial ticks
ax.set_rlabel_position(-22.5)  # Move radial labels away from plotted line
ax.grid(True)
p1 = ax.fill(theta,two_student.iloc[:,0],'m',alpha = 0.75)           #填充
p2 = ax.fill(theta,two_student.iloc[:,1],color='grey',alpha = 0.75)           #填充
ax.set_theta_zero_location('E')         #设置极轴方向
t = ax.set_title("A plot", va='bottom')
l = ax.legend(handles=[s1,s2],labels=list(two_student.columns),bbox_to_anchor=(1.3,1))
plt.show()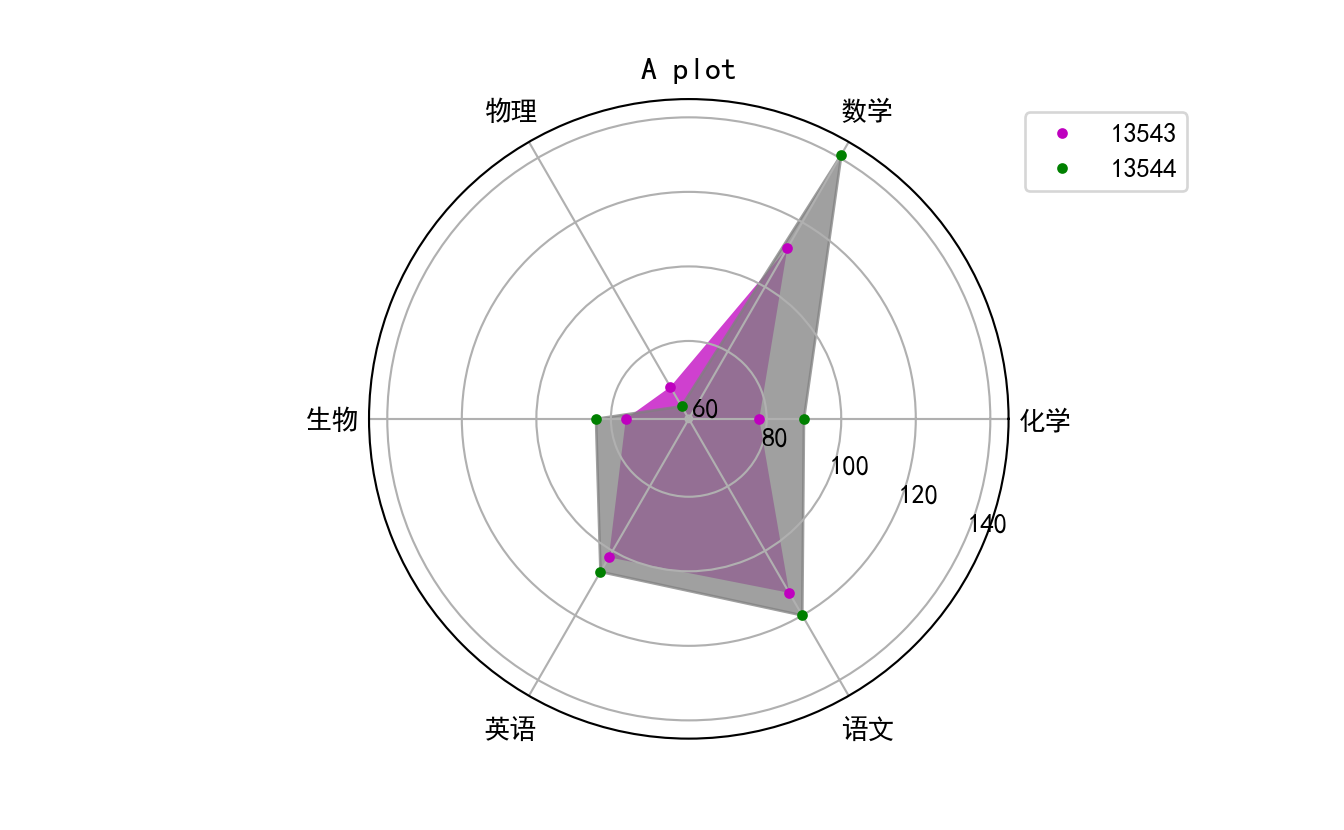
8.12 帕累托图
主要用来绘制顺序数据
# 即要绘制双轴
pdata = pd.DataFrame({"one":[1,2,3]},index=["a","b","c"])
fig,ax = plt.subplots(1,1,figsize=(8,8))
b = pdata.plot(kind="bar",ax=ax,legend=False)
ax.set_ylim(0,6)
(0.0, 6.0)ax.yaxis.set_major_locator(ticker.LinearLocator(3))
ax2 = ax.twinx()
pdatacum = pdata.apply(lambda x:x.cumsum()/sum(x))
l = pdatacum.plot(ax=ax2,legend=False,marker=".")
ax2.set_ylim(0,1)(0.0, 1.0)ax2.yaxis.set_major_locator(ticker.LinearLocator(6))
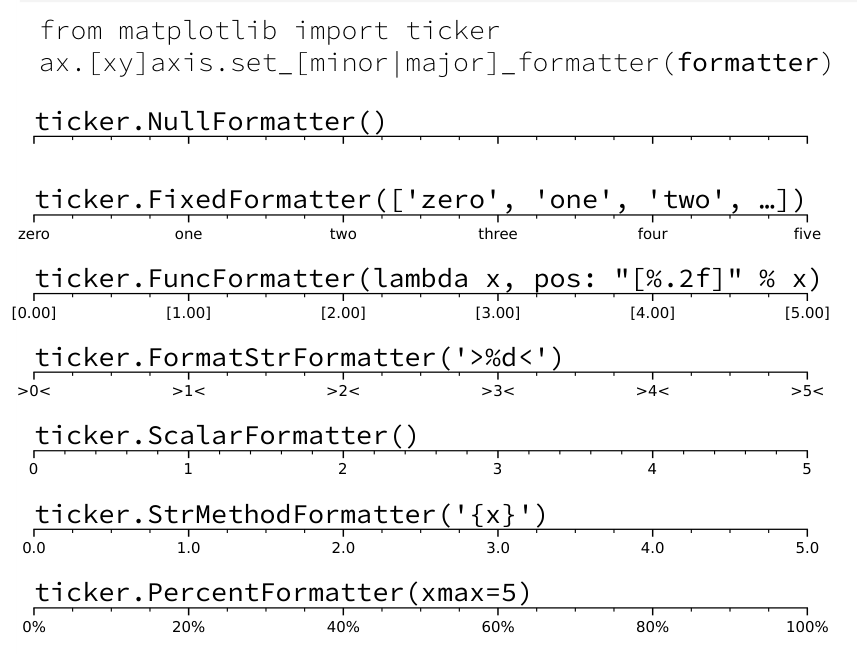
ax2.yaxis.set_major_formatter(ticker.PercentFormatter(xmax=1))
plt.show()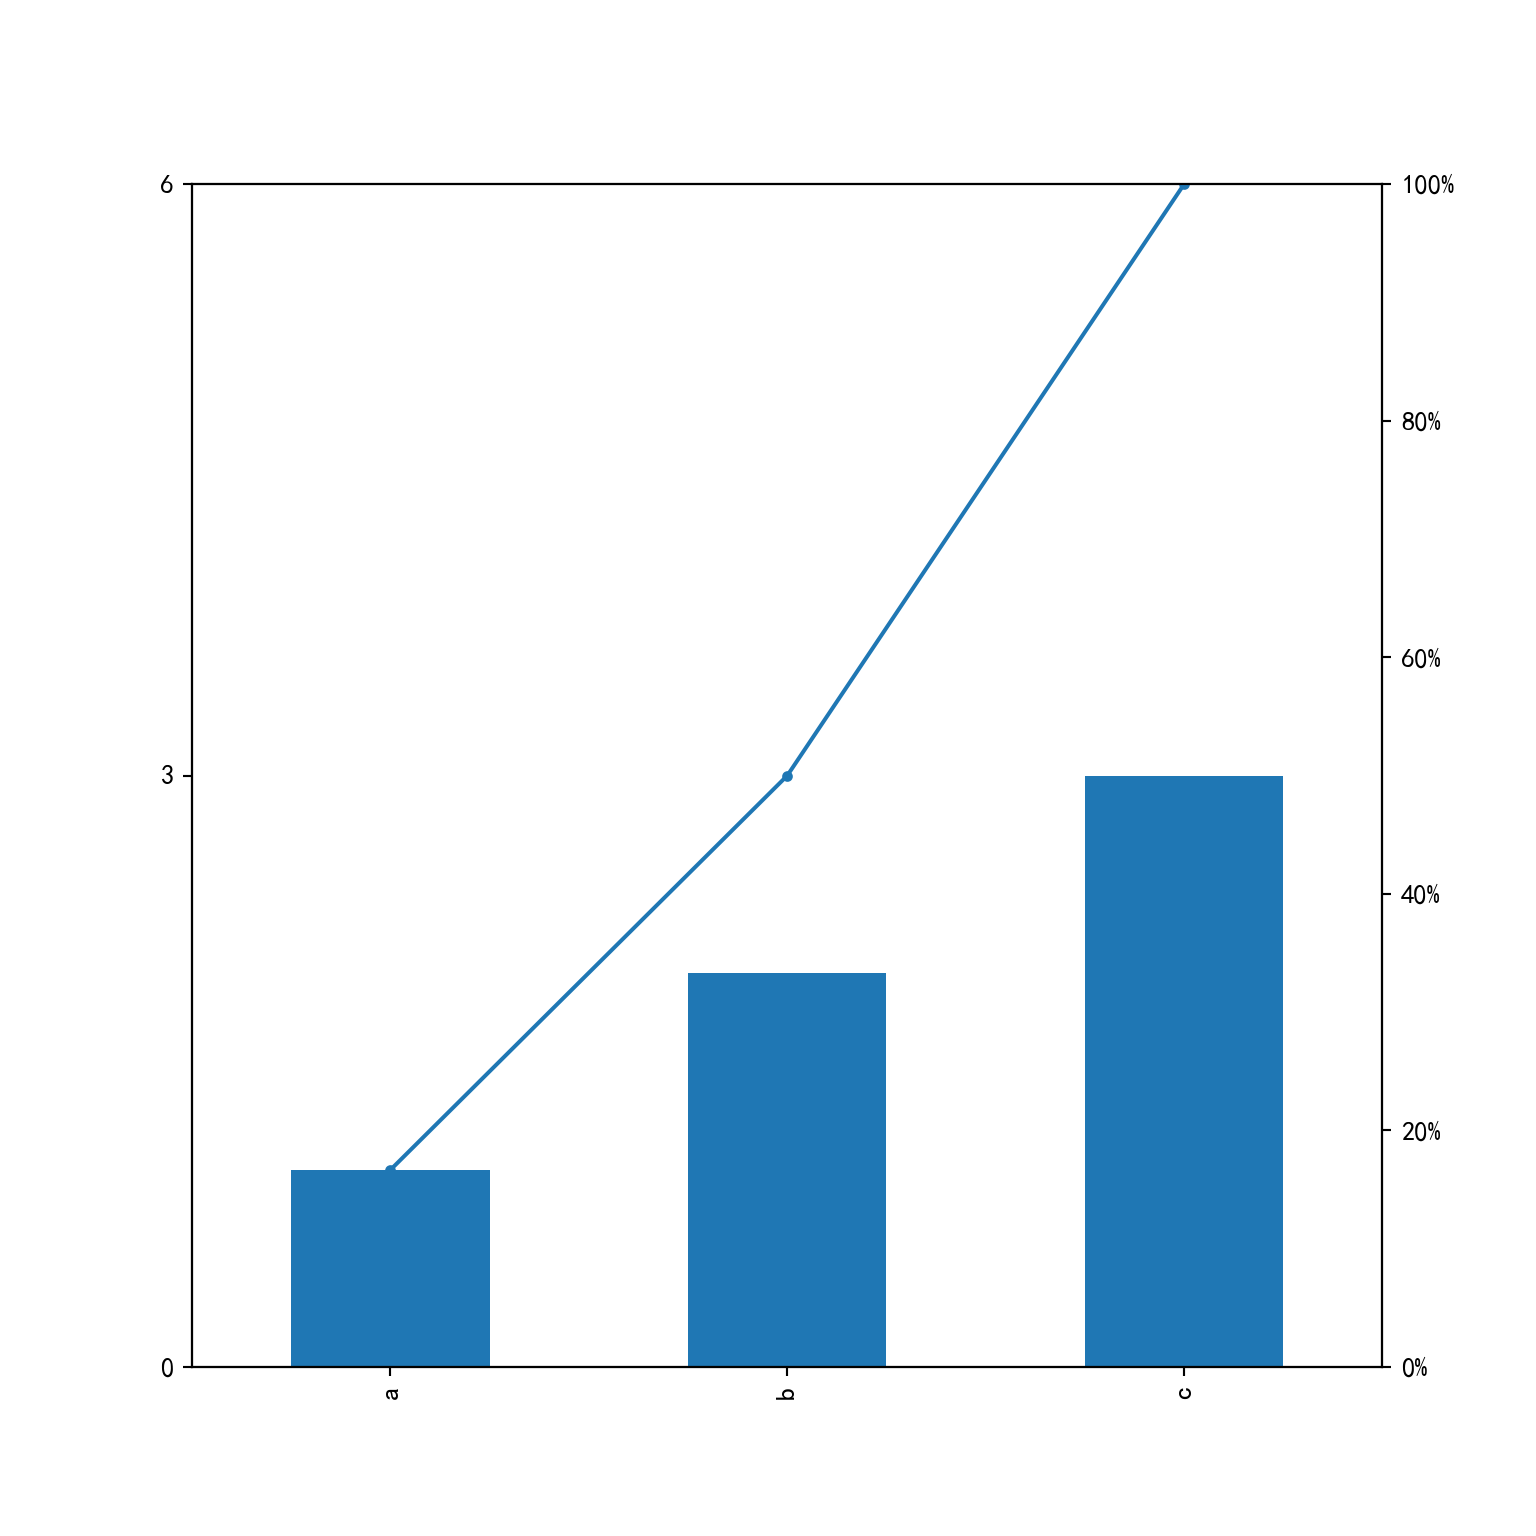
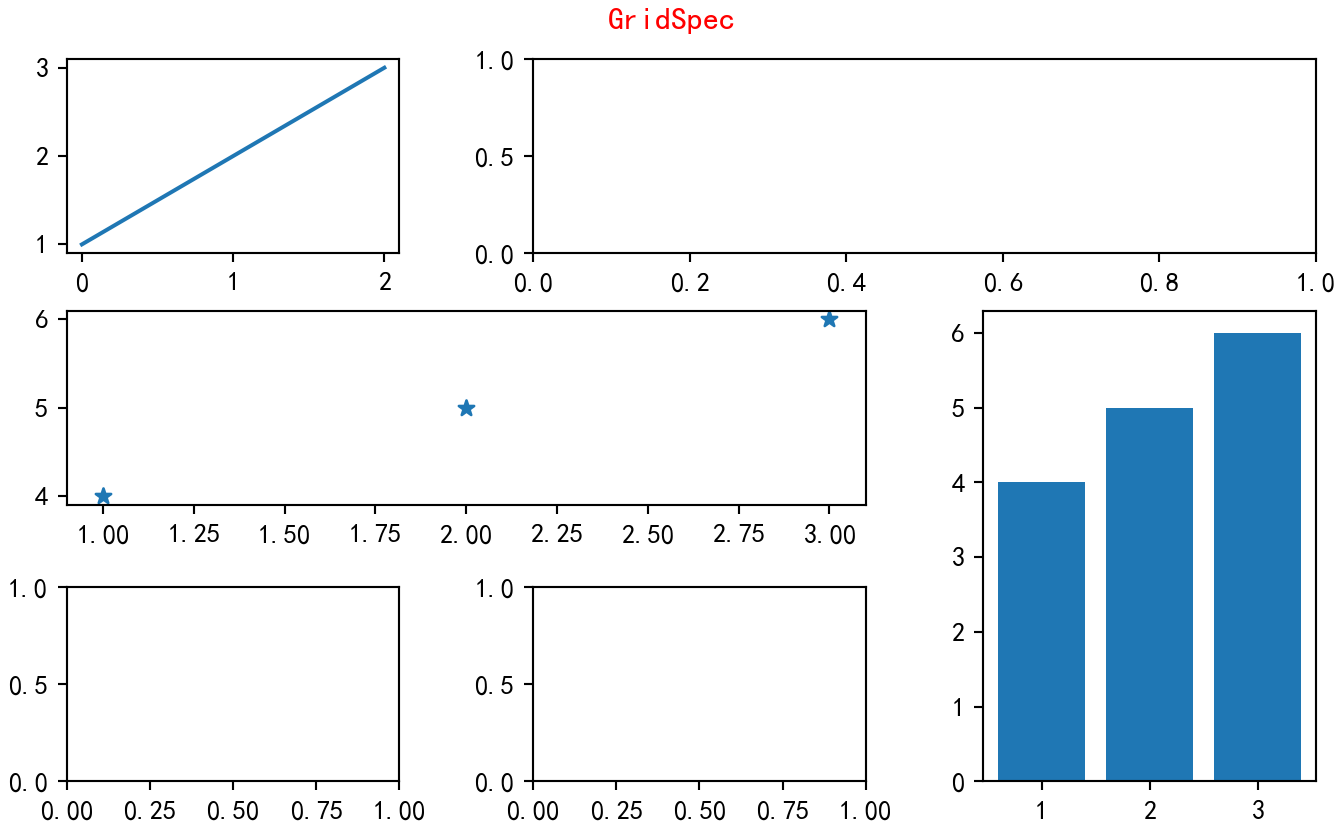
8.13 多图
主要介绍进行任意axes组合的方法
matplotlib.gridspec.GridSpec(nrows, ncols, figure=None, left=None, bottom=None, right=None, top=None, wspace=None, hspace=None, width_ratios=None, height_ratios=None)
# 生成任意排列的图形
fig = plt.figure(dpi=100,
                 constrained_layout=True,#类似于tight_layout,使得各子图之间的距离自动调整【类似excel中行宽根据内容自适应】
                )
gs = GridSpec(3, 3, figure=fig)#GridSpec将fiure分为3行3列,每行三个axes,gs为一个matplotlib.gridspec.GridSpec对象,可灵活的切片figure
ax1 = fig.add_subplot(gs[0, 0:1])
plt.plot([1,2,3])
ax2 = fig.add_subplot(gs[0, 1:3])#gs[0, 0:3]中0选取figure的第一行,0:3选取figure第二列和第三列

#ax3 = fig.add_subplot(gs[1, 0:2])
plt.subplot(gs[1, 0:2])#同样可以使用基于pyplot api的方式
plt.scatter([1,2,3],[4,5,6],marker='*')

ax4 = fig.add_subplot(gs[1:3, 2:3])
plt.bar([1,2,3],[4,5,6])

ax5 = fig.add_subplot(gs[2, 0:1])
ax6 = fig.add_subplot(gs[2, 1:2])

fig.suptitle("GridSpec",color='r')
plt.show()